cytoflowgui.view_plugins.stats_1d#
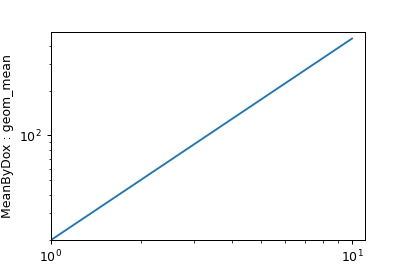
Plots a line plot of a statistic.
Each variable in the statistic (ie, each variable chosen in the statistic operation’s Group By) must be set as Variable or as a facet.
- Statistic
Which statistic to plot.
- Feature
The column in the statistic to plot on the Y axis (often a channel name.)
- Variable
The statistic variable put on the X axis. Must be numeric.
- X Scale, Y Scale
How to scale the X and Y axes.
- Horizontal Facet
Make muliple plots, with each column representing a subset of the statistic with a different value for this variable.
- Vertical Facet
Make multiple plots, with each row representing a subset of the statistic with a different value for this variable.
- Hue Facet
Make multiple bars with different colors; each color represents a subset of the statistic with a different value for this variable.
- Color Scale
If Color Facet is a numeric variable, use this scale for the color bar.
- Error Statistic
A statistic to use to make the error bars. Must have the same variables as the statistic in Statistic.
- Subset
Plot only a subset of the statistic.
- class cytoflowgui.view_plugins.stats_1d.Stats1DParamsHandler(*args: Any, **kwargs: Any)[source]#
Bases:
Controller
- class cytoflowgui.view_plugins.stats_1d.Stats1DHandler(*args: Any, **kwargs: Any)[source]#
Bases:
ViewHandler- indices = <traits.traits.ForwardProperty object>#
- numeric_indices = <traits.traits.ForwardProperty object>#
- levels = <traits.traits.ForwardProperty object>#
- features = <traits.traits.ForwardProperty object>#