HOWTO: Use the logicle scale in other matplotlib plots#
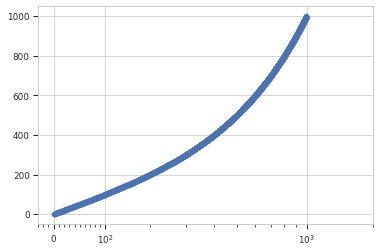
cytoflow implements an interesting scaling routine called
logicle. It’s a biexponential function that is “linear” near
zero and transitions smoothly to a logarithmic scale. This
is particularly useful for flow cytometry data, which often
has data clustered around zero where a log-base-10 scale would
introduce aliasing. (See the papers referenced below for
rationale and implementation details; cytoflow uses the C++
code from the second paper.)
I have been asked several times how to use a logicle scale
for other matplotlib plots. This is difficult because,
unlike the log scale, logicle is parameterized – the
precise location of the linear-to-log transition, how many decades
of negative data, etc. all need to be specified in order to
create a usable scaling function.
However, I recognize that there are occasions when you may want
to use a plot that is not baked into cytoflow. Here’s a
code fragment that should get you pointed in the right direction.
However, this is an explicitly unsupported use-case – please
don’t file bug reports if you’re having trouble with this:
import matplotlib.pyplot as plt
import cytoflow as flow

x = range(1, 1000)
y = range(1, 1000)

tube1 = flow.Tube(file = 'data/RFP_Well_A3.fcs',
                  conditions = {'Dox' : 10.0})
tube2 = flow.Tube(file='data/CFP_Well_A4.fcs',
                  conditions = {'Dox' : 1.0})

import_op = flow.ImportOp(conditions = {'Dox' : 'float'},
                          tubes = [tube1, tube2])

ex = import_op.apply()
logicle = flow.utility.scale_factory('logicle', ex, channel = 'V2-A')

# the channel = 'V2-A' parameter in the scale_factory() call tells
# the logicle scale instance to use that channel to estimate its
# parameters.  if you want to use a condition or statistic, say
# condition = ..... or statistic = ..... instead.

plt.scatter(x, y)
ax = plt.gca()
plt.gca().set_xscale('logicle',
                     **logicle.get_mpl_params(ax.get_xaxis()))
References#
- [1] A new “Logicle” display method avoids deceptive effects of logarithmic
scaling for low signals and compensated data. Parks DR, Roederer M, Moore WA. Cytometry A. 2006 Jun;69(6):541-51. PMID: 16604519 http://onlinelibrary.wiley.com/doi/10.1002/cyto.a.20258/full
- [2] Update for the logicle data scale including operational code
implementations. Moore WA, Parks DR. Cytometry A. 2012 Apr;81(4):273-7. doi: 10.1002/cyto.a.22030 PMID: 22411901 http://onlinelibrary.wiley.com/doi/10.1002/cyto.a.22030/full