cytoflowgui.view_plugins.radviz#
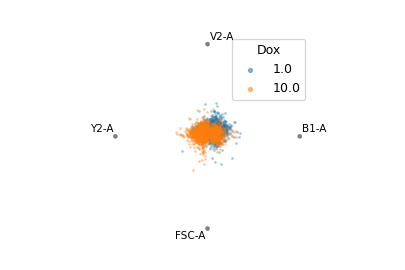
Plots a radviz plot. Radviz plots project multivariate plots into two dimensions. Good for looking for clusters.
- Channels
The channels to plot, and their scales. Drag the blue dot to re-order.
- Add Channel, Remove Channel
Add or remove a channel
- Horizonal Facet
Make multiple plots. Each column has a unique value of this variable.
- Vertical Facet
Make multiple plots. Each row has a unique value of this variable.
- Color Facet
Plot different values of a condition with different colors.
- Color Scale
Scale the color palette and the color bar
- Tab Facet
Make multiple plots in differen tabs; each tab’s plot has a unique value of this variable.
- Subset
Plot only a subset of the data in the experiment.
- class cytoflowgui.view_plugins.radviz.RadvizParamsHandler(*args: Any, **kwargs: Any)[source]#
Bases:
Controller
- class cytoflowgui.view_plugins.radviz.ChannelHandler(*args: Any, **kwargs: Any)[source]#
Bases:
Controller
- class cytoflowgui.view_plugins.radviz.RadvizHandler(*args: Any, **kwargs: Any)[source]#
Bases:
ViewHandler- channels = <traits.traits.ForwardProperty object>#