cytoflow.operations.flowclean#
The flowclean module has two classes:
FlowCleanOp – gates an Experiment based on a variation in fluorescence
channels over time.
FlowCleanDiagnostic – diagnostic views for FlowCleanOp.
- class cytoflow.operations.flowclean.FlowCleanOp[source]#
Bases:
HasStrictTraitsThis module gates events from time slices whose density is low or whose events’ fluorescence intensity varies substantially from other slices. This is often due to a bubble or transient clog in the flow cell.
The operation assesses whether a tube is “clean” using an algorithm described below. If the tube is already clean, only low-density slices are gated. If the tube is not clean, then a cleaning is attempted, gating slices that are substantially statistically different than the majority. Cleanliness is then assessed again. After calling
estimate(),tube_statusis set for each tube, indicating whether it wasCLEAN(clean before the operation),CLEANED(clean after the gated events are dropped), orUNCLEAN(still unclean after the gated events are dropped.)This estimation is applied to every tube independently – that is, to every subset of events with a unique combination of experimental metadata (as determined by the experiment’s
Experiment.metadata). Thus, there is nobyattribute, as with many other data-driven gating operations.When the
applyfunction is called, a new boolean condition is created. Its name is the same as thenameof the operation; it isTrueif the event remains after the tube is cleaned, andFalseif it was in a dropped slice.Caution
For some data sets, the default parameters can make this algorithm really zealous. Please check the diagnostic plots and the
tube_statisticstables to make sure this operation is performing like you expect it to, and adjust the parameters accordingly! Doing so will probably require an understanding of exactly what the algorithm is doing – see the Notes section below for details.- name#
The operation name; determines the name of the new metadata column.
- Type:
Str
- time_channel#
The channel that represents time – often
HDR-Tor similar.- Type:
Str
- channels#
Which fluorescence channel or channels are analyzed for variation?
- Type:
List(Str)
- scale#
Re-scale the data in the specified channels before cleaning. If a channel is in
channelsbut not inscale, the current package-wide default (set withset_default_scale) is used.Important
This algorithm works much better when fluorescence channels are scaled (and not just left
linear.)- Type:
Dict(Str : {“linear”, “logicle”, “log”})
- segment_size#
The number of events in each bin in the analysis.
- Type:
Int (default = 1000)
- density_cutoff#
The minimum density CDF to keep.
- Type:
Float (default = 0.05)
- max_discontinuity#
The critical “continuity” – determines how “different” an adjacent segment must be to be for a tube to be flagged as suspicious.
- Type:
Float (default = 0.1)
- max_drift#
The maximum any individual channel can drift before being flagged as needing cleaning.
- Type:
Float (default = 0.15)
- max_mean_drift#
The maximum the mean of all channels’ drift can be before the tube is flagged as needing to be cleaned.
- Type:
Float (default = 0.13)
- segment_cutoff#
The minimum sum-of-measures’ CDF to keep.
- Type:
Float (default = 0.05)
- detect_worst_channels_range#
Should
FlowCleanOptry to detect the worst channels and use them to flag tubes or trim events? If this attribute is greater than 0, choose channels using the range of the mean of the bins’ fluorescence distribution. Often used in combination withdetect_worst_channels_sd.- Type:
Int (default = 0)
- detect_worst_channels_sd#
Should
FlowCleanOptry to detect the worst channels and use them to flag tubes or trim events? If this attribute is greater than 0, choose channels using the standard deviation of the mean of the bins’ fluorescence distribution. Often used in combination withdetect_worst_channels_range.- Type:
Int (default = 0)
- measures#
Which measures should be considered when comparing segments? Must be a subset of the default.
- Type:
List(String) (default = (“5th percentile”, “20th percentile”, “50th percentile”, “80th percentile”, “95th percentile”, “mean”, “variance”, “skewness”) ).
- dont_clean#
If
True, never clean – just remove low-density bins.- Type:
Bool (default = False)
- force_clean#
If
True, force cleaning even if the tube passes the original quality checks. Remember, the operation always gates low-density bins.- Type:
Bool (default = False)
- tube_status#
Set by
estimate, has the status of each tube. If the tube didn’t need cleaning, it’s set to CLEAN. If the tube was cleaned and then passed the drift and max discontinuity tests, it’s set to CLEANED. Otherwise, the tube status is set to UNCLEAN.- Type:
Dict(Tube : {“CLEAN”, “UNCLEAN”, “CLEANED”})
- tube_statistics#
Set by
estimate, has statistics about the drift of each tube.- Type:
Dict(Str : pd.DataFrame)
Notes
This is inspired by the algorithm in the Bioconductor package
flowCut[1]. The algorithm works in the following way:Bin the events along the time they were collected. The bin size is determined by
segment_size.Compute the density (events per unit time) of each bin, estimate a kernel density of that distribution, and remove bins whose density’s CDF is less than
density_cutoff.For each channel, compute the mean intensity in each bin (after scaling the data), then compute the mean drift and the differences between adjacent bins. The mean drift is the (difference between the maximum and minimum mean) divided by the (98th - 2nd percentile difference). If the mean drift is greater than
max_drift, set thetube_statusto UNCLEAN.Compute the mean drift across all channels. If the mean drift is greater than
max_mean_drift, set the tube status to UNCLEAN.For each channel, see if any adjacent bins have differences in their mean fluorescence more than
max_discontinuity. If so, set the tube status as UNCLEAN. Otherwise, set the tube status as CLEAN.If the tube needs to be cleaned, compute the measures from
measuresfor each bin in each channel, then sum them over all the channels to obtain a single number for each bin. Estimate a kernel density of that distribution and find the peak with the largest prominence. Fit a normal curve with that peak as the center and discard any bins whose sum-of-measures’ two-sided CDF is less thansegment_cutoff.Re-compute the drift in each channel, the mean drift and maximum drift, and the maximum discontinuity. If any of these are outside of spec, leave the tube status as UNCLEAN. Else, set the tube status as CLEANED.
References
Examples
Make a little data set.
>>> import cytoflow as flow
>>> import_op = flow.ImportOp()
>>> import_op.tubes = [flow.Tube(file = "Plate01/RFP_Well_A3.fcs",
...                              conditions = {'Dox' : 10.0}),
...                    flow.Tube(file = "Plate01/CFP_Well_A4.fcs",
...                              conditions = {'Dox' : 1.0})]
>>> import_op.conditions = {'Dox' : 'float'}
>>> ex = import_op.apply()
Create and parameterize the operation.
>>> fc_op = flow.FlowCleanOp(name = 'FlowClean',
...                          time_channel = 'HDR-T',
...                          channels = ['V2-A', 'Y2-A'],
...                          scale = {'V2-A' : 'log',
...                                   'Y2-A' : 'log'})
Set the gate of events that need to be cleaned
>>> fc_op.estimate(ex)
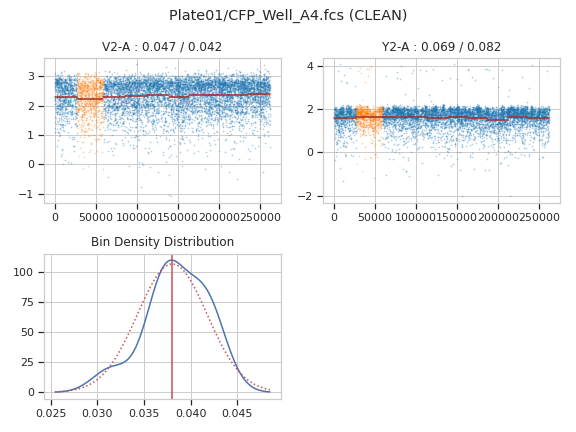
Plot a diagnostic view for each tube.
>>> fc_op.default_view().plot(ex, plot_name = "Plate01/RFP_Well_A3.fcs")
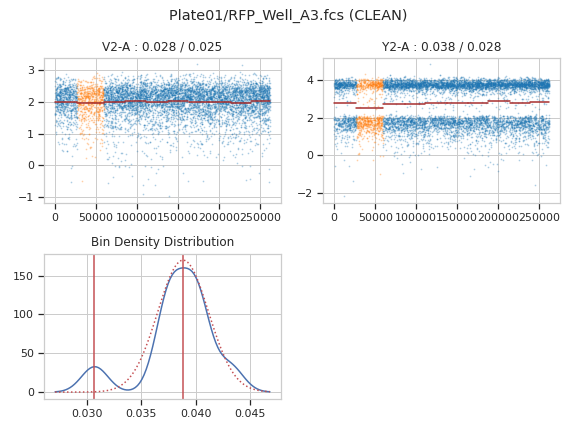
>>> fc_op.default_view().plot(ex, plot_name = "Plate01/CFP_Well_A4.fcs")
Apply the gate
>>> ex2 = fc_op.apply(ex)
- apply(experiment)[source]#
Creates a new condition based on whether the event was dropped by the cleaning procedure in
estimate()– essentially, a “gate” that cleans each tube’s data- Parameters:
experiment (
Experiment) – theExperimentto apply the gate to.- Returns:
a new
Experimentwith the new condition.- Return type:
- class cytoflow.operations.flowclean.FlowCleanDiagnostic[source]#
Bases:
HasStrictTraitsA diagnostic view for
FlowCleanOp.Each fluorescence channel is plotted with a scatterplot. Bin means are shown with green line segments, and dropped bins are plotted in orange instead of blue. The plot title shows the channel drift and maximum discontinuity before cleaning, as well as the drift and max discontinuity after cleaning (if cleaning was applied.)
There are one or two additional distributions also plotted. The first shows the KDE estimate of bin densities, the peaks that the peak finding algorithm found, and the normal distribution used to determine if a bin density was “abnormal”. If the tube needed cleaning, the second shows a KDE estimate of the sum-of-measures distribution, with peaks and the normal distribution used to determine if a bin was to be excluded. (The actual cutoffs are determined by
density_cutoffandsegment_cutoff, respectively.- op#
The operation instance whose diagnostic we’re plotting. Set automatically if you create the instance using
FlowCleanOp.default_view.- Type:
Instance(
FlowCleanOp)
- enum_plots(experiment)[source]#
Returns an iterator over the possible plots that this View can produce – in this case, the
cytoflow.operations.import_op.Tubefilenames. The values returned can be passed to theplot_namekeyword ofplot.- Parameters:
experiment (
Experiment) – TheExperimentthat will be producing the plots.
- plot(experiment, **kwargs)[source]#
Make a diagnostic plot for a
FlowCleanOpoperation.- Parameters:
plot_name (Str) – The tube filename to plot. The filenames can also be retrieved from
enum_plots. This can be a full path or just the filename.alpha (float (default = 0.25)) – The alpha blending value, between 0 (transparent) and 1 (opaque).
s (int (default = 0.5)) – The size in points^2.
marker (a matplotlib marker style, usually a string) – Specfies the glyph to draw for each point on the scatterplot. See matplotlib.markers for examples. Default: ‘o’
Notes
Other
kwargsare passed to matplotlib.pyplot.scatter