cytoflow.views.long_table#
“Plot” a long (or “tidy”) tabular view of a statistic.
LongTableView – the IView class that makes the plot.
- class cytoflow.views.long_table.LongTableView[source]#
Bases:
HasStrictTraits“Plot” a long (or “tidy”) tabular view of a statistic. Mostly useful for GUIs.
- statistic#
The name of the statistic to plot. Must be a key in the
Experiment.statisticsattribute of theExperimentbeing plotted. Each level of the statistic’s index must be used inrow_facet,column_facet,subrow_facet, orsubcolumn_facet.- Type:
Str
- subset#
A Python expression used to select a subset of the statistic to plot.
- Type:
Str
Examples
Make a little data set.
>>> import cytoflow as flow
>>> import_op = flow.ImportOp()
>>> import_op.tubes = [flow.Tube(file = "Plate01/RFP_Well_A3.fcs",
...                              conditions = {'Dox' : 10.0}),
...                    flow.Tube(file = "Plate01/CFP_Well_A4.fcs",
...                              conditions = {'Dox' : 1.0})]
>>> import_op.conditions = {'Dox' : 'float'}
>>> ex = import_op.apply()
Add a threshold gate
>>> ex2 = flow.ThresholdOp(name = 'Threshold',
...                        channel = 'Y2-A',
...                        threshold = 2000).apply(ex)
Add a statistic
>>> ex3 = flow.ChannelStatisticOp(name = "ByDox",
...                               channel = "Y2-A",
...                               by = ['Dox', 'Threshold'],
...                               function = len).apply(ex2)
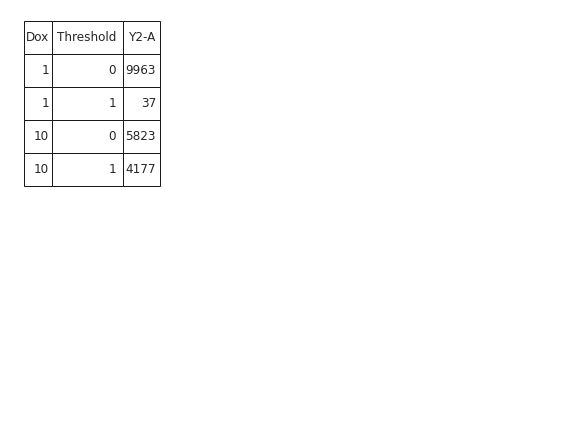
“Plot” the table
>>> flow.LongTableView(statistic = "ByDox").plot(ex3)