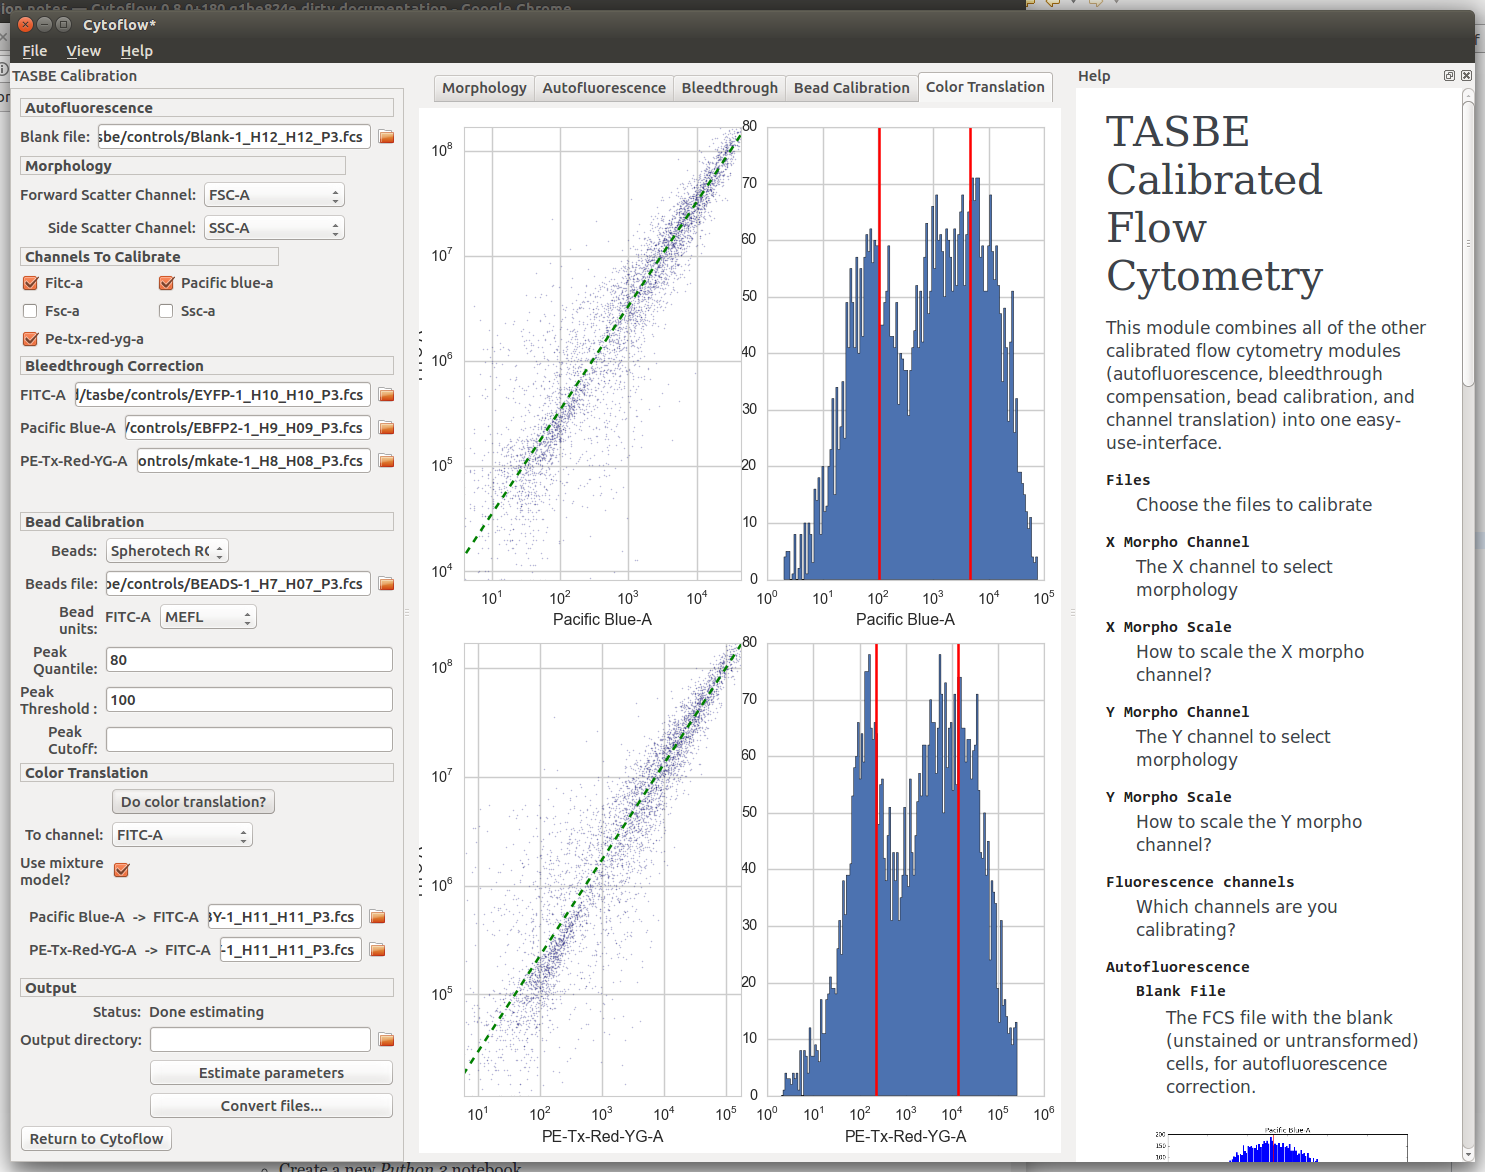
Screenshots of the Cytoflow GUI#
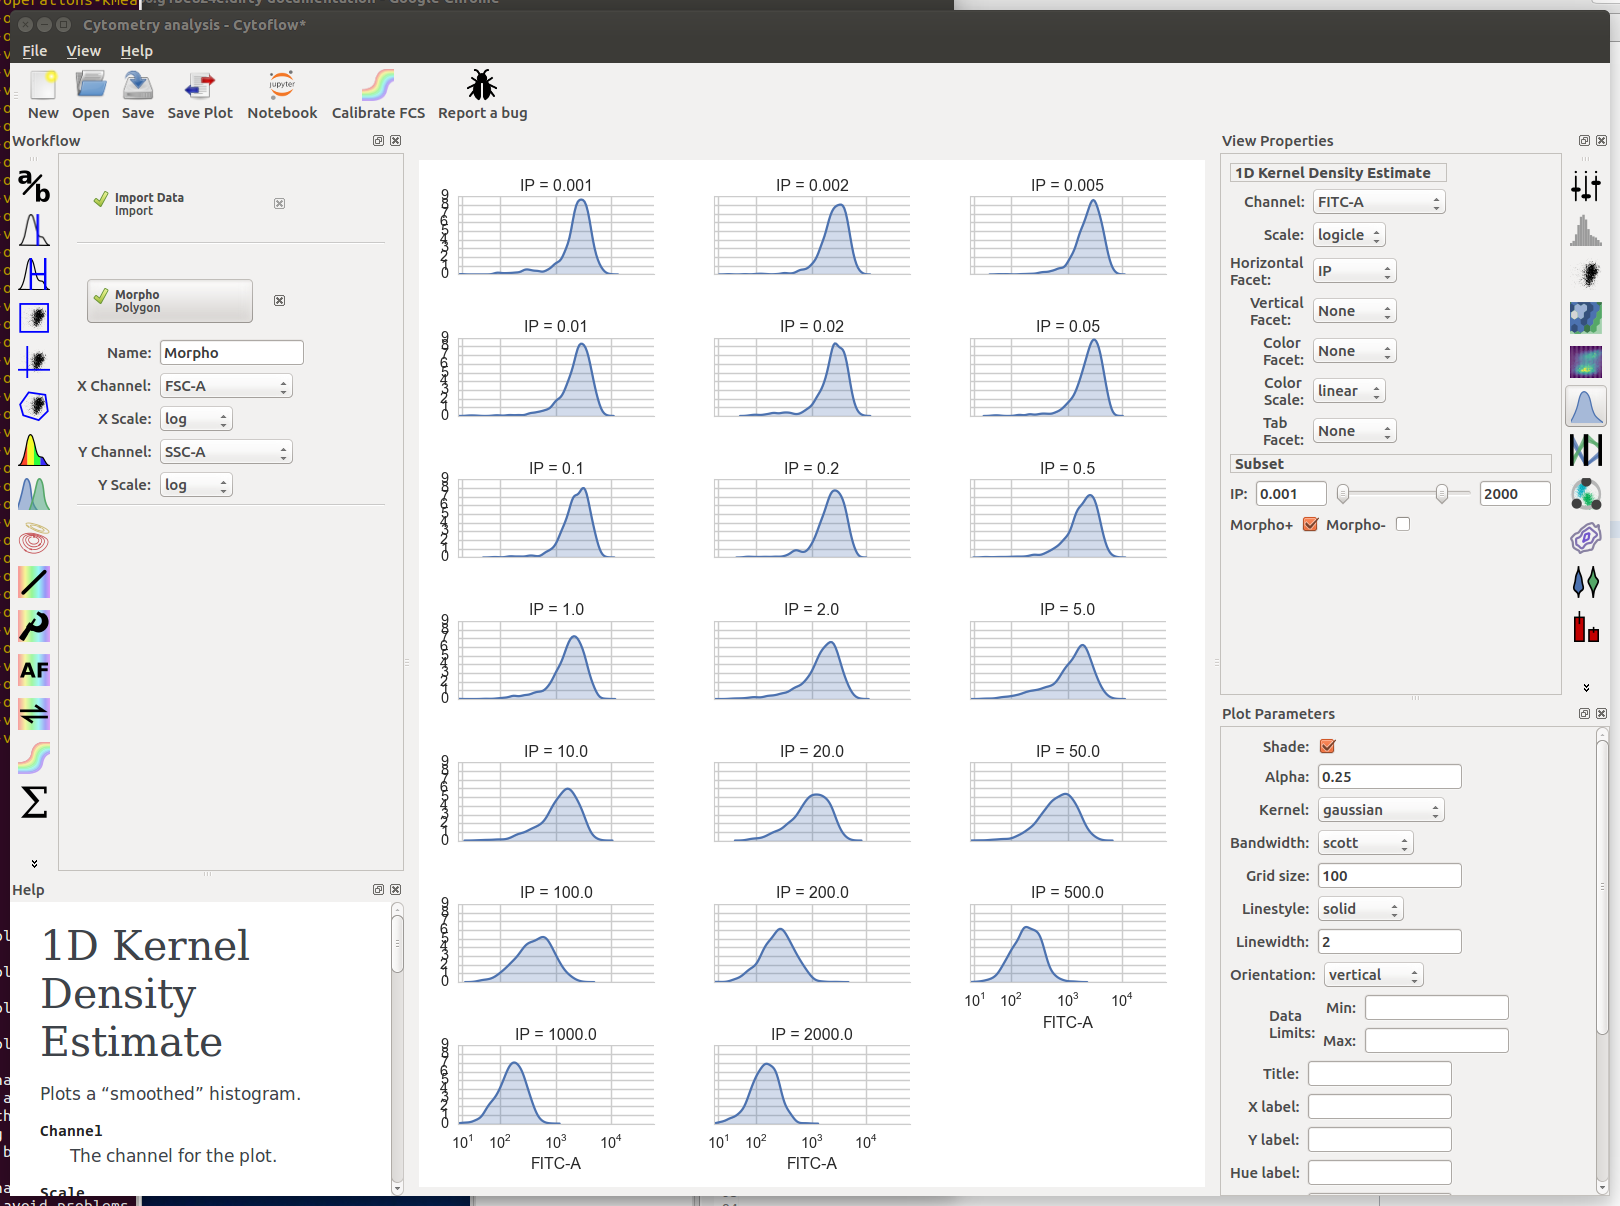
The main GUI.
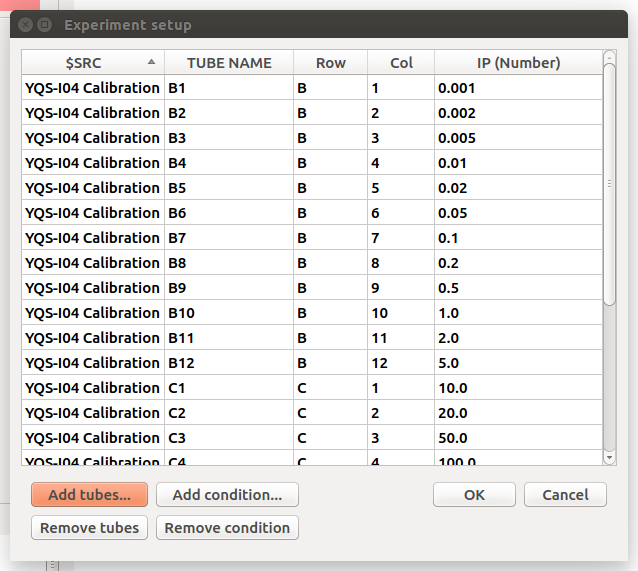
The experiment editor.
The plot editor.
Convert FCS files to calibrated units.
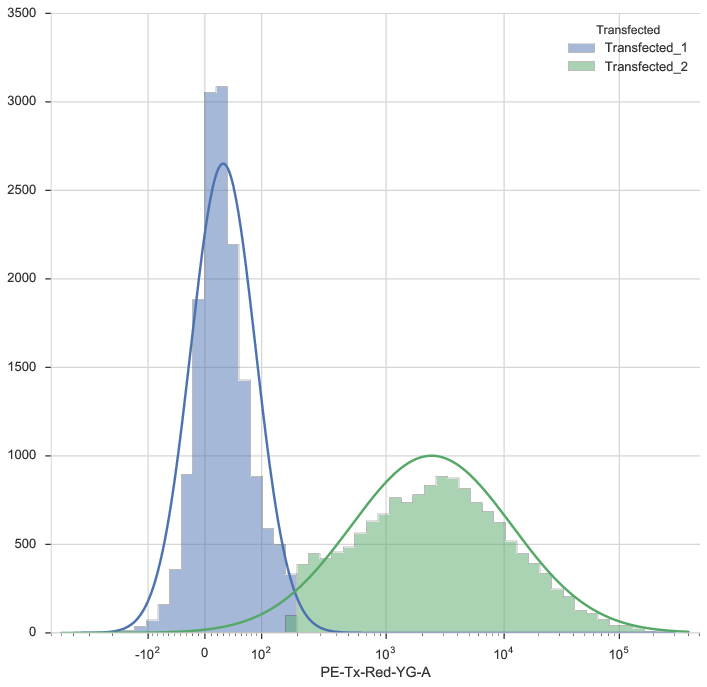
One-dimensional Gaussian mixture models.
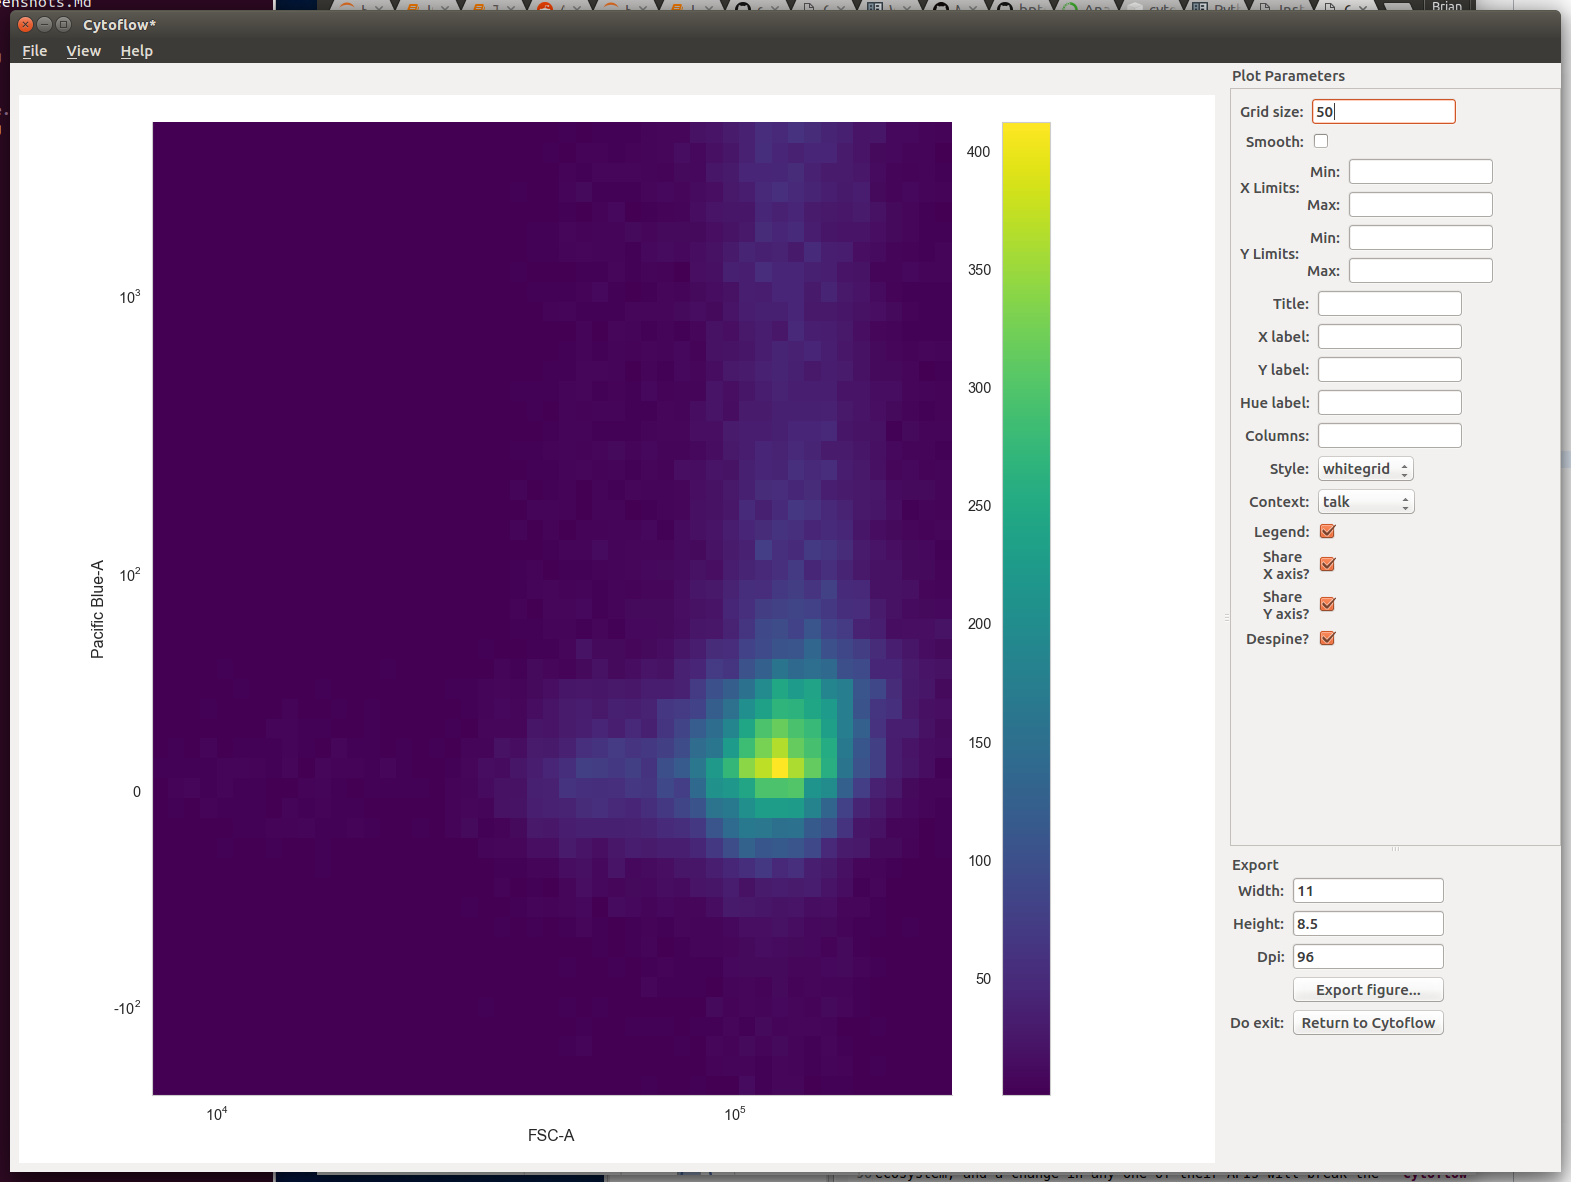
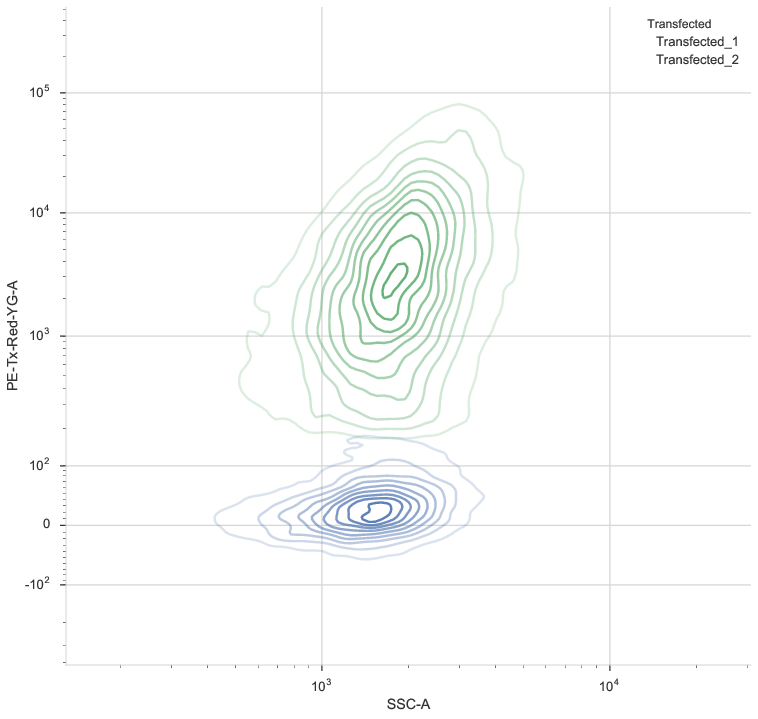
Two-dimensional kernel density estimates.
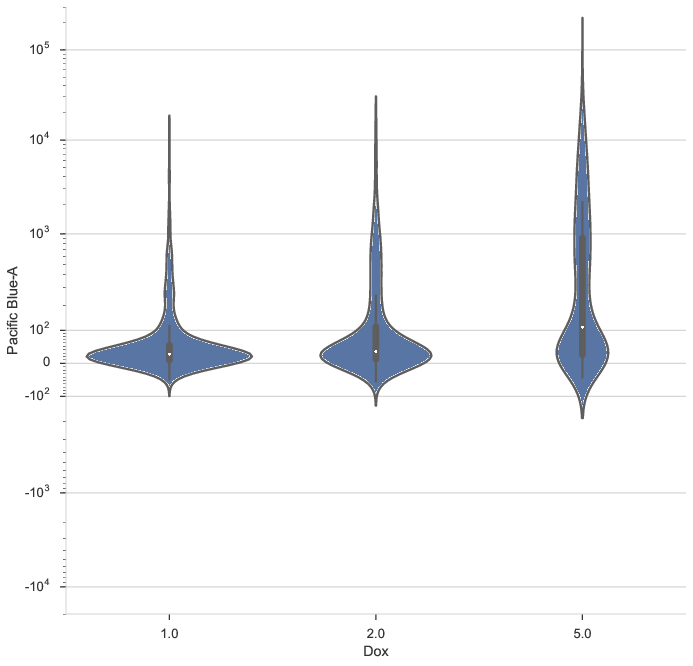
Violin plots to compare distributions.
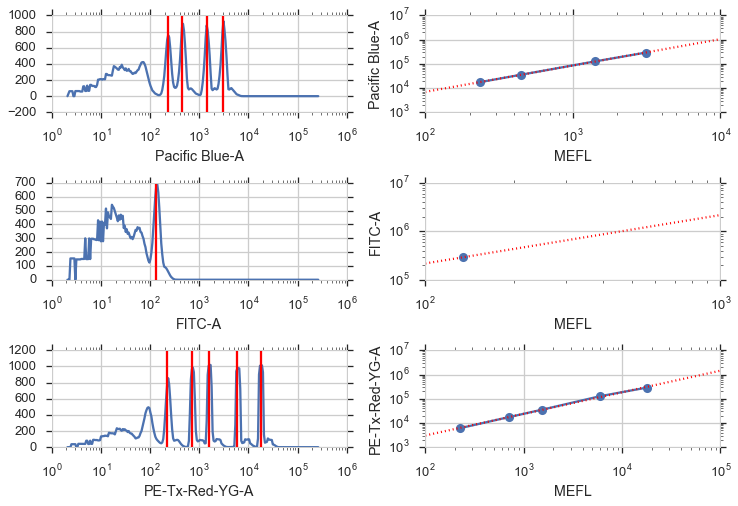
Calibrate raw data to physical calibrants like beads.
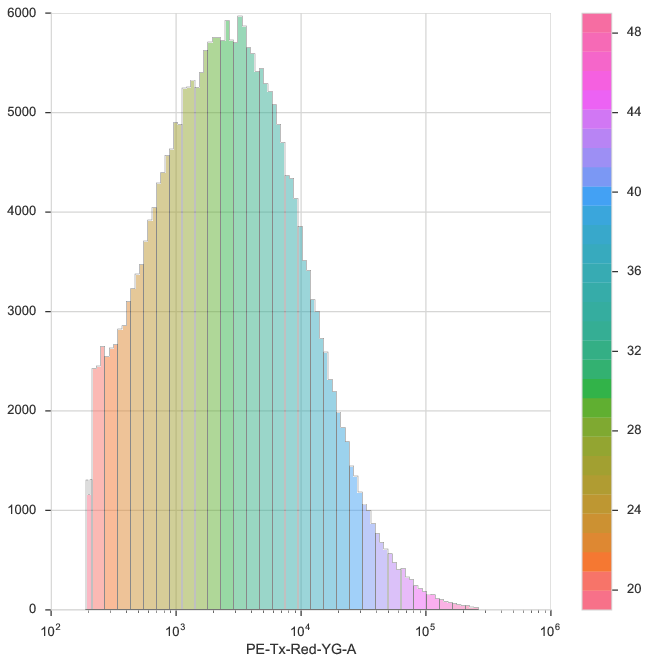
Bin data to analyze subsets.
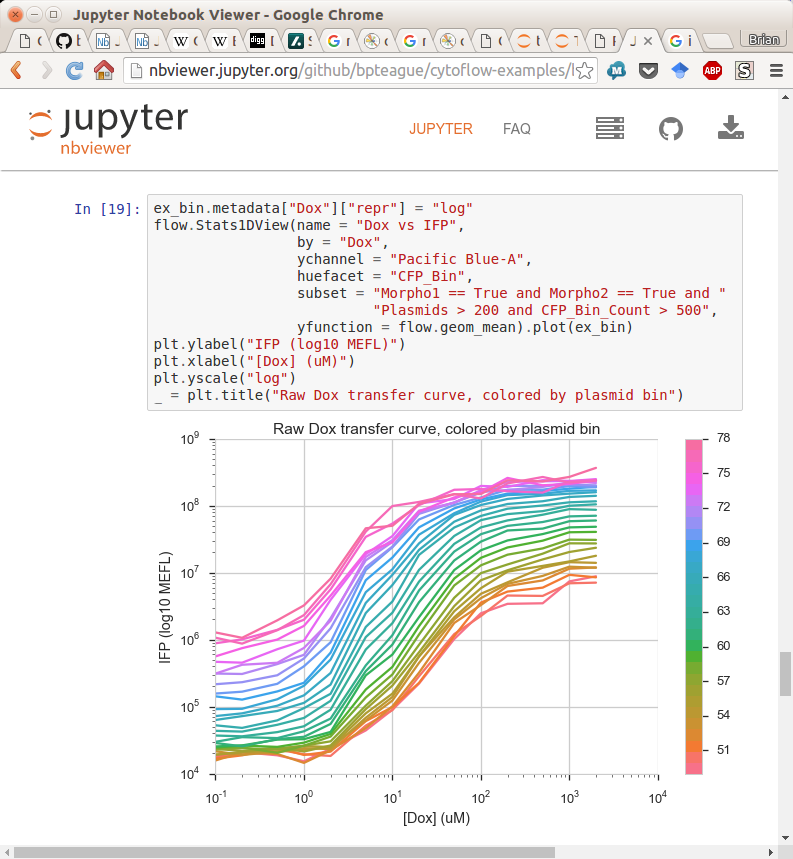
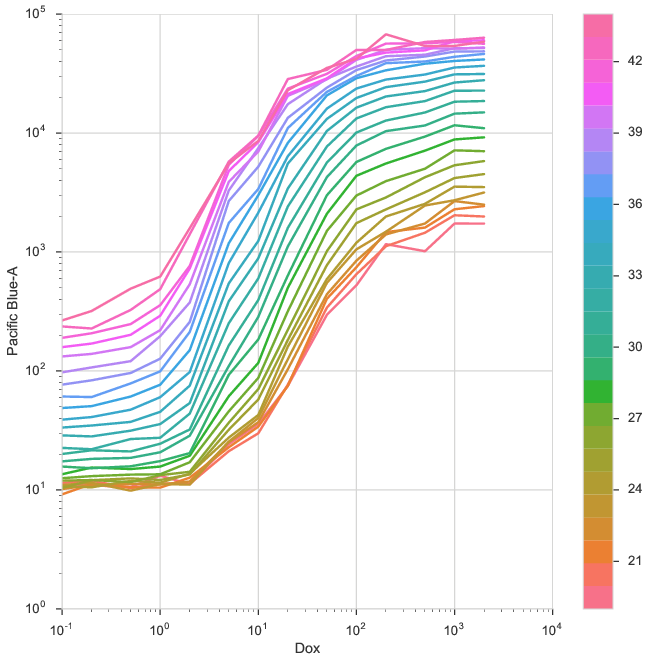
Summarize data with statistics plots.
Export straight to a Jupyter notebook.