Operation and View Gallery#
Below is a gallery of Cytoflow’s operations and views. Each header will take you to the corresponding manual page.
Operations#
Gates#
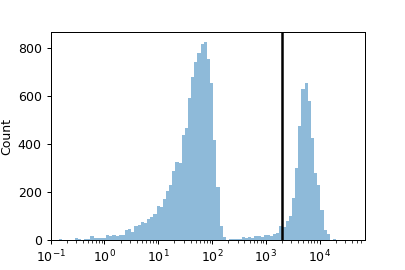
Threshold Gate

Range Gate
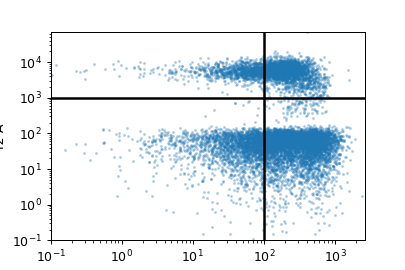
Quad Gate
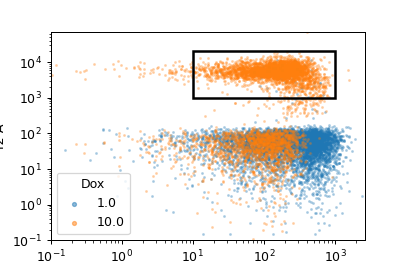
Rectangle Gate
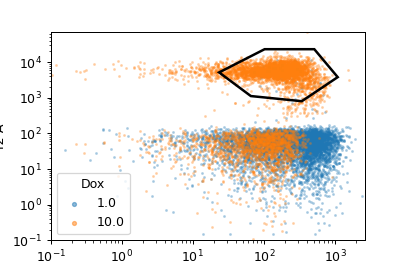
Polygon Gate
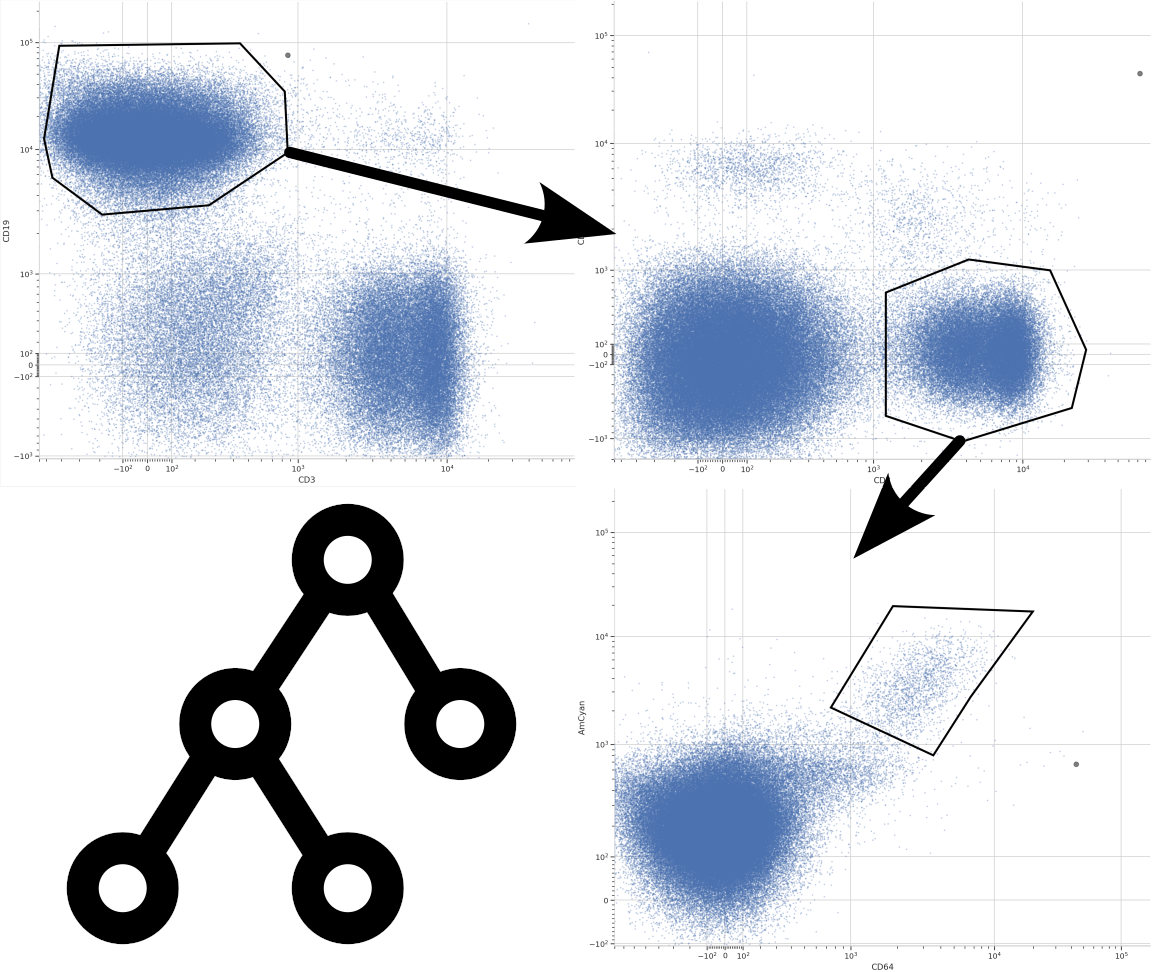
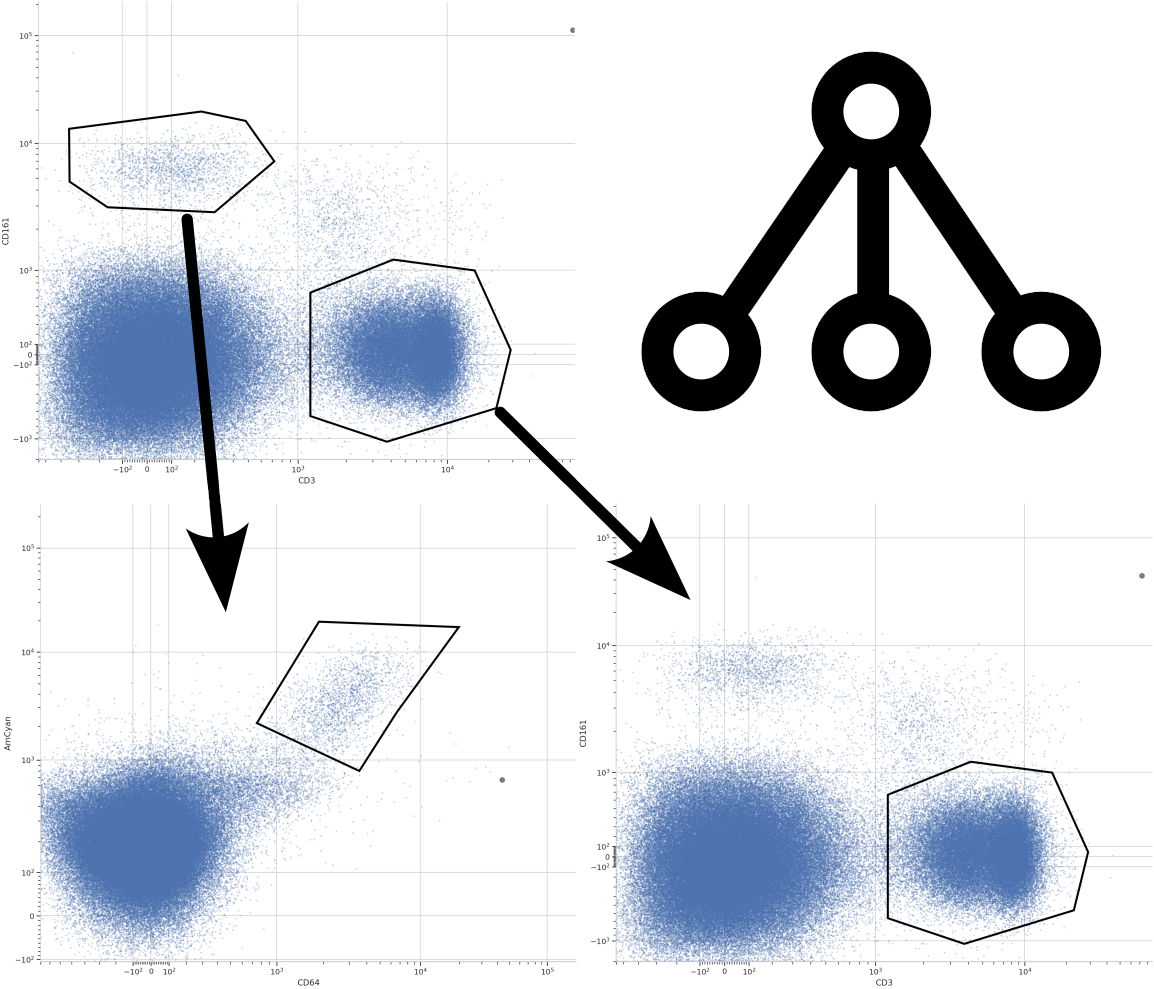
Gate Hierarchy
Gate Categories
Preprocessing#
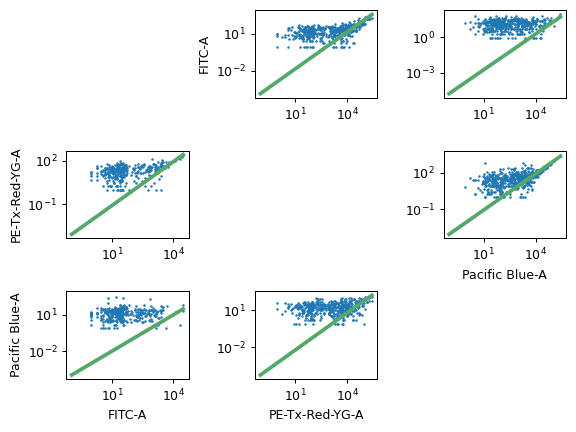
Linear Bleedthrough Compensation

FlowClean
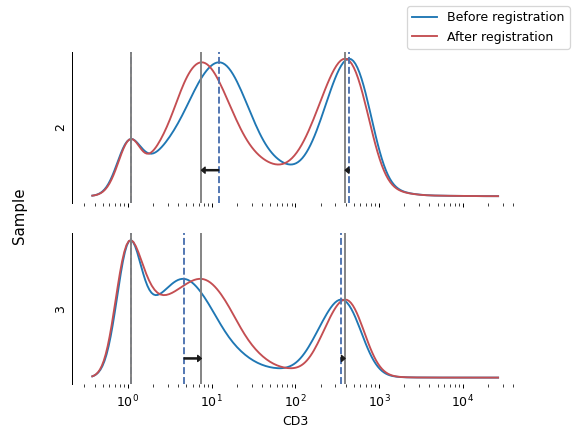
Peak Registration
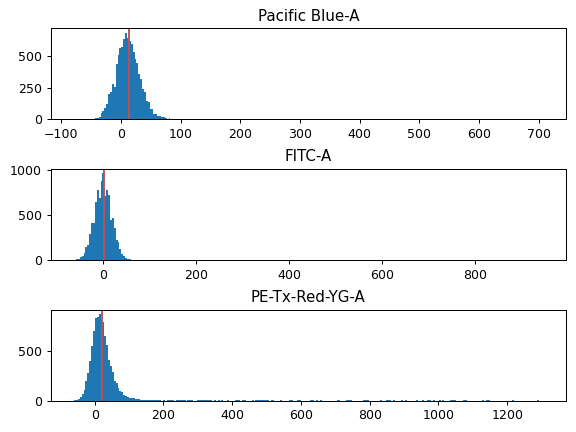
Autofluorescence Correction
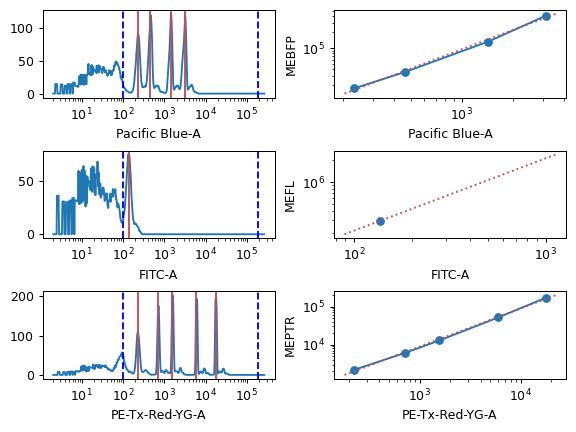
Bead Calibration
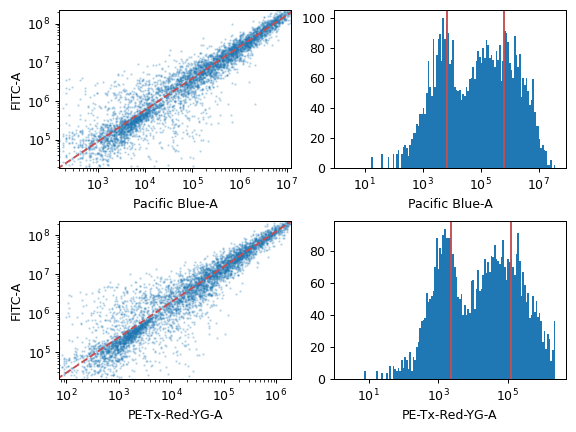
Color Translation
TASBE
Clustering#
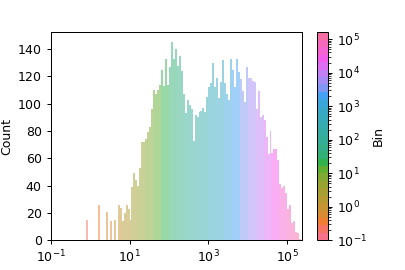
Binning
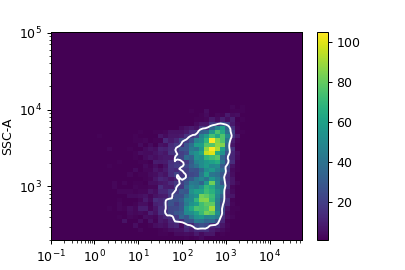
Density Gate
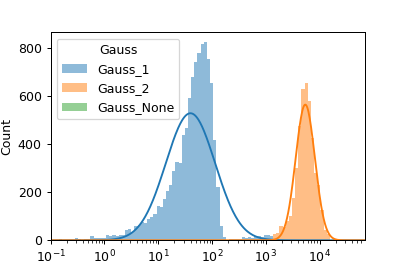
One Dimensional Gaussian Mixtures
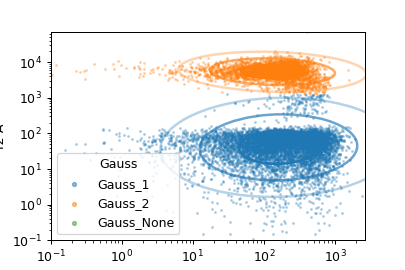
Two Dimensional Gaussian Mixtures
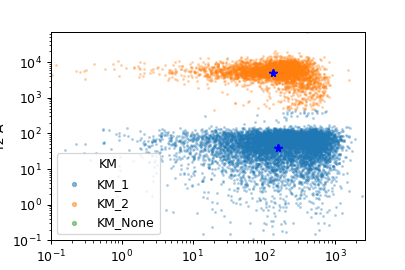
K-Means Clustering
FlowPeaks
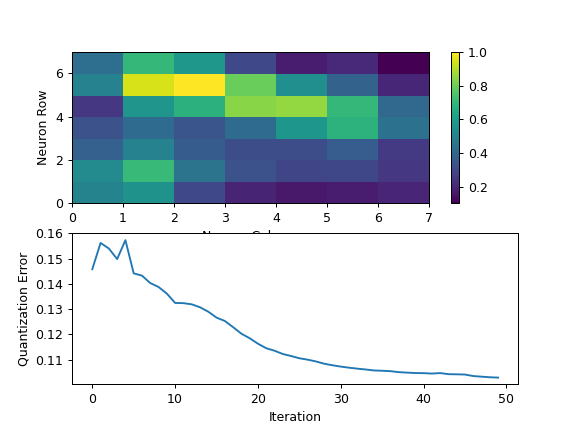
Self-organizing maps (SOM)

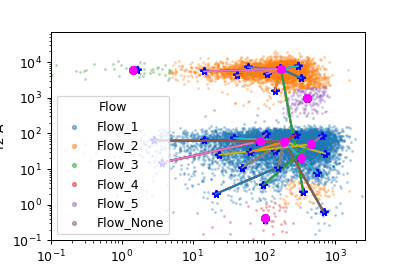
Minimum Spanning Tree
Dimensionality Reduction#
Principal Components Analysis (PCA)
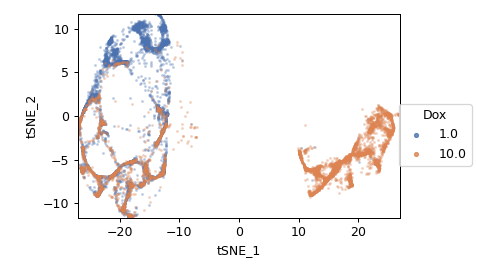
t-Distributed Stochastic Neighborhood Embedding (tSNE)
Statistics and Transforms#

Channel Statistic

Multi-Channel Statistic

Transform Statistic

Ratio
Views#
One Dimensional#
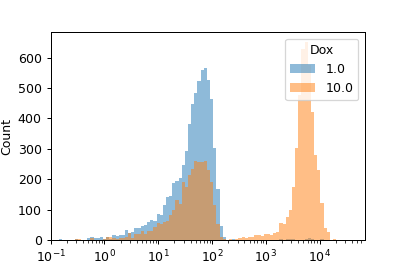
Histogram
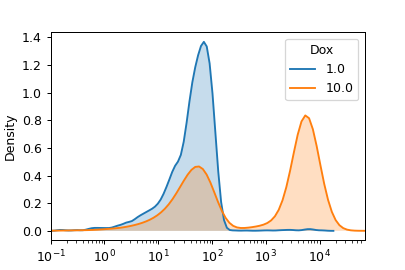
One-dimensional KDE
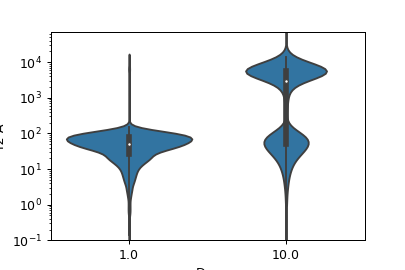
Violin Plot
Two Dimensional#
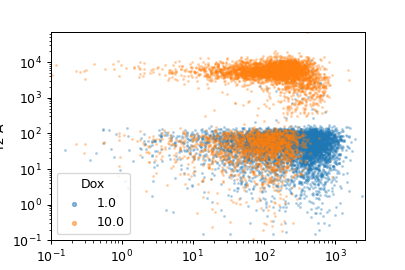
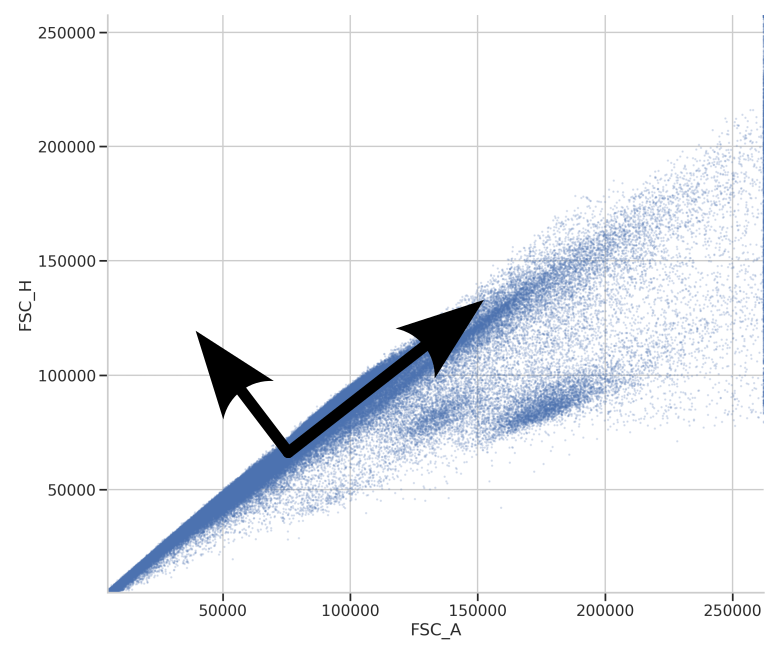
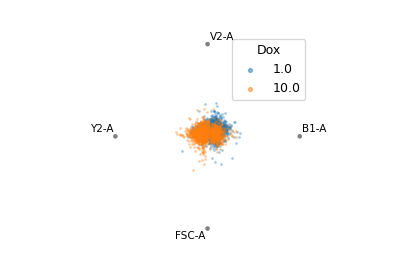
Scatterplot
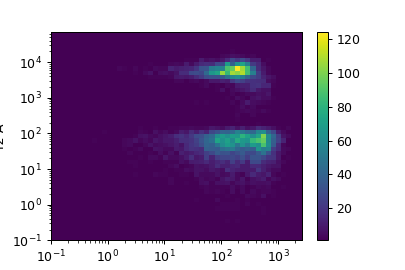
Density Plot
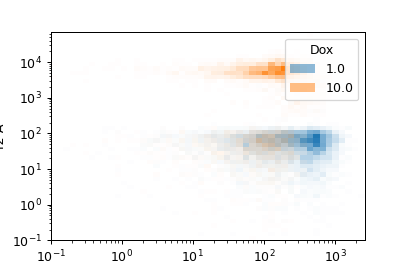
Two-dimensional histogram
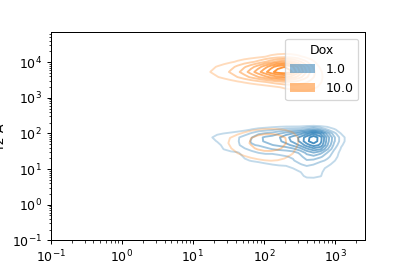
Two-dimensional KDE
Multi-Dimensional#
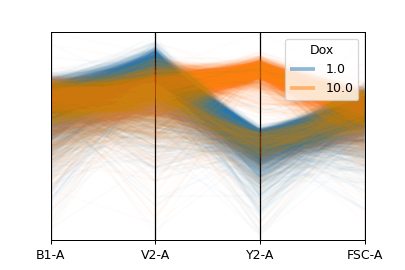
Parallel Coordinates Plot
Radviz
Statistics#
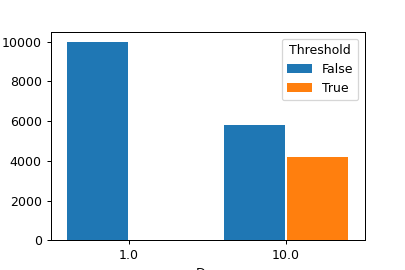
Bar Chart
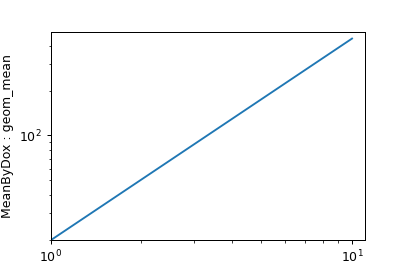
1D Statistics Plot
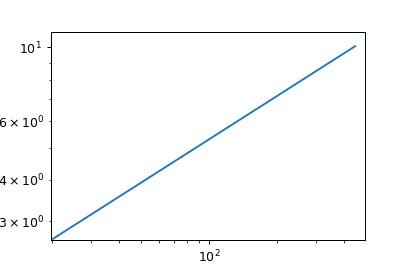
2D Statistics Plot
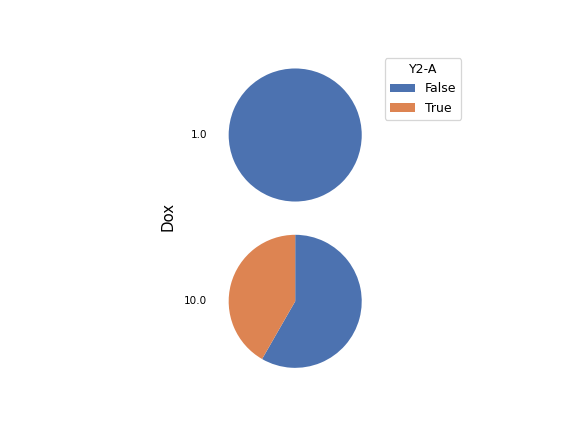
Matrix View
Minimum Spanning Tree
Miscellaneous#
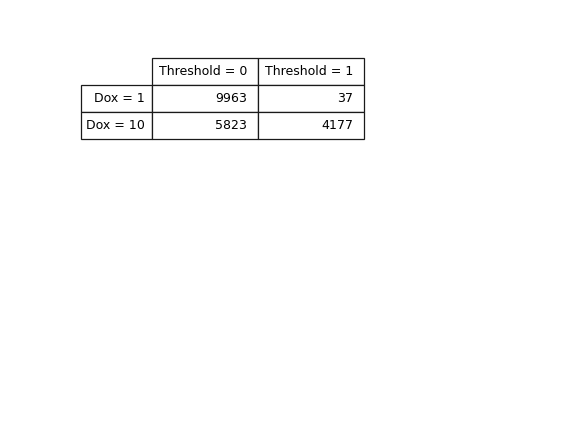
Table View
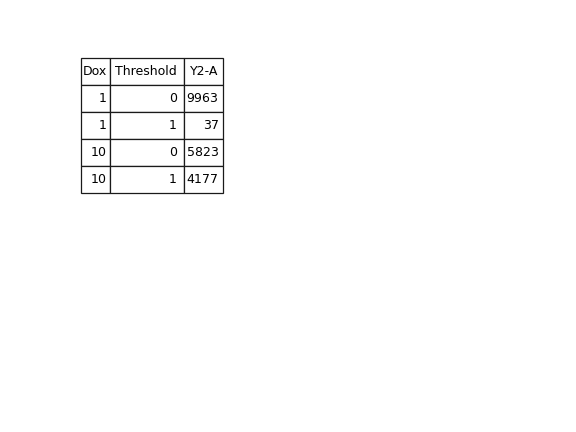
Long Table View
FCS Export