Operation and View Gallery
Below is a gallery of Cytoflow’s operations and views. Each header will take you to the corresponding manual page.
Operations
|
|
|
|
|
|
|
|
|
|
|
|
|
|
|
|
|

|
Views
|
|
|
|
|
|
|
|
|
|
|
|
|
|
Operations
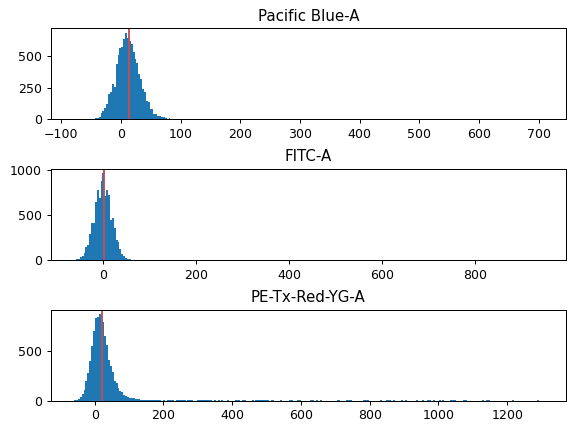
- Autofluorescence correction
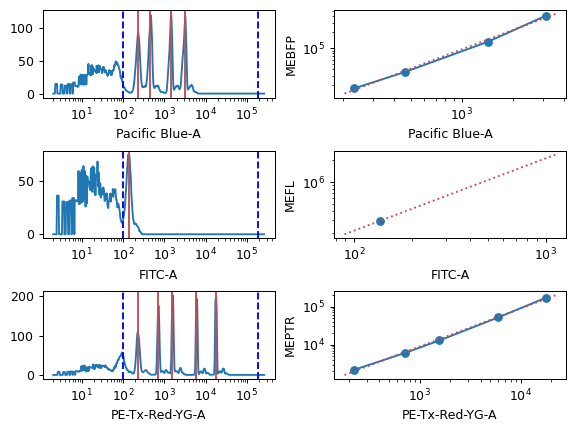
- Bead Calibration
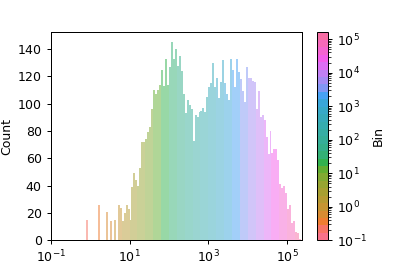
- Binning
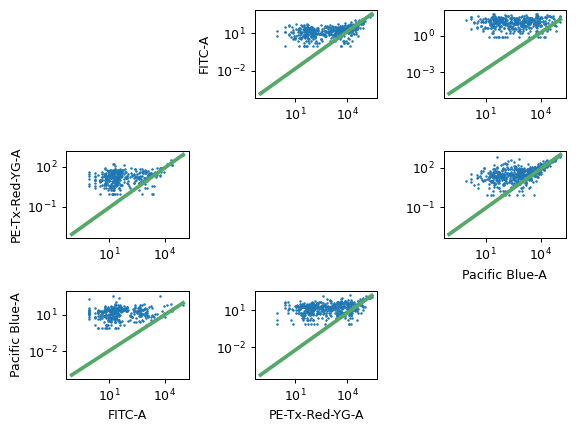
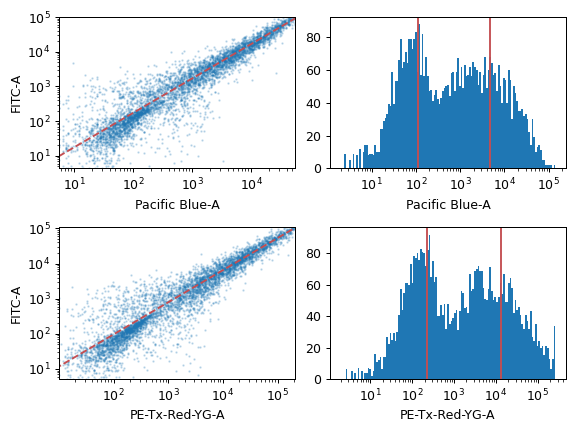
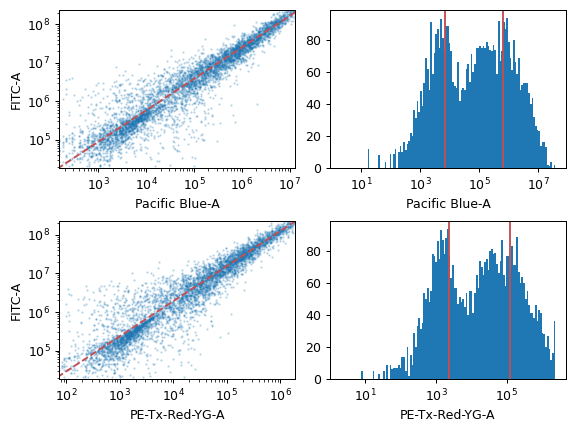
- Linear Bleedthrough Compensation
- Channel statistic
- Color Translation
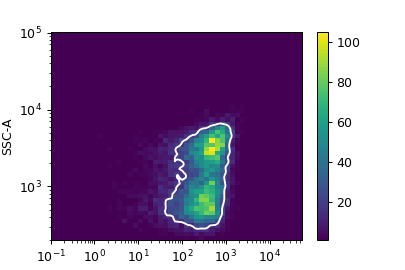
- Density Gate
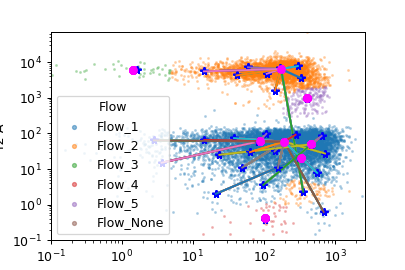
- FlowPeaks Clustering
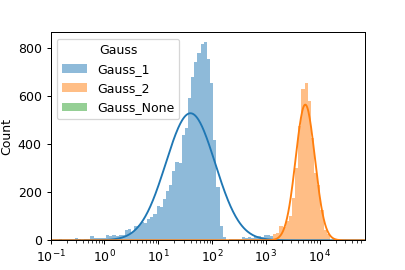
- Gaussian Mixture Model (1D)
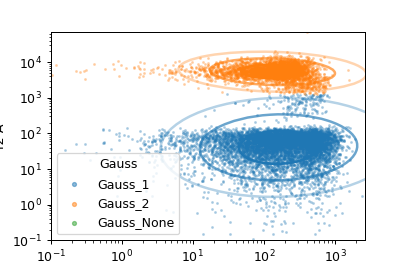
- Gaussian Mixture Model (2D)
- Import Files
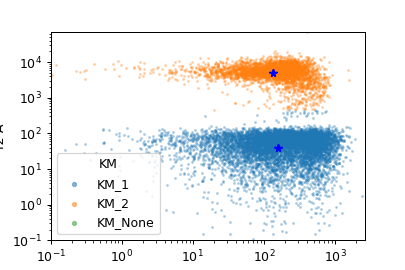
- KMeans
- Principal Component Analysis
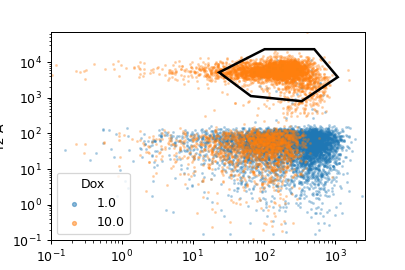
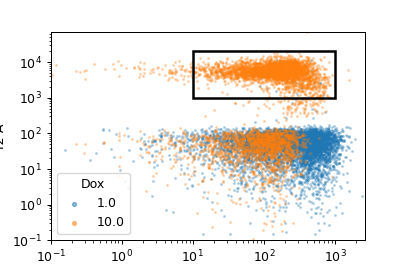
- Polygon Gate
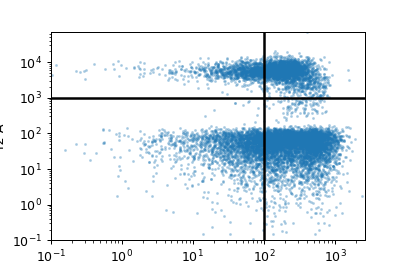
- Quadrant Gate
- Range Gate
- 2D Range Gate
- Ratio
- TASBE Calibrated Flow Cytometry
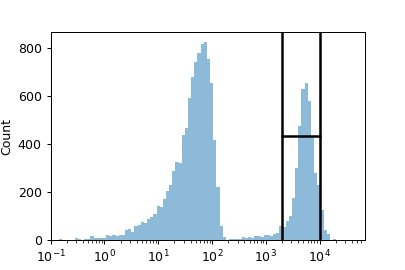
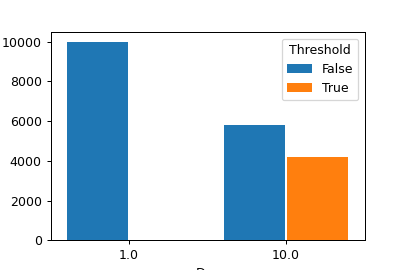
- Threshold Gate
- Transform statistic