HOWTO: Export plots
I’m really proud of the plots you can produce with Cytoflow, and I hope
that you will find them nice enough to use in your talks, posters and
publications! To help you do so, it’s easy to export the current plot to
a variety of file formats.
Procedure
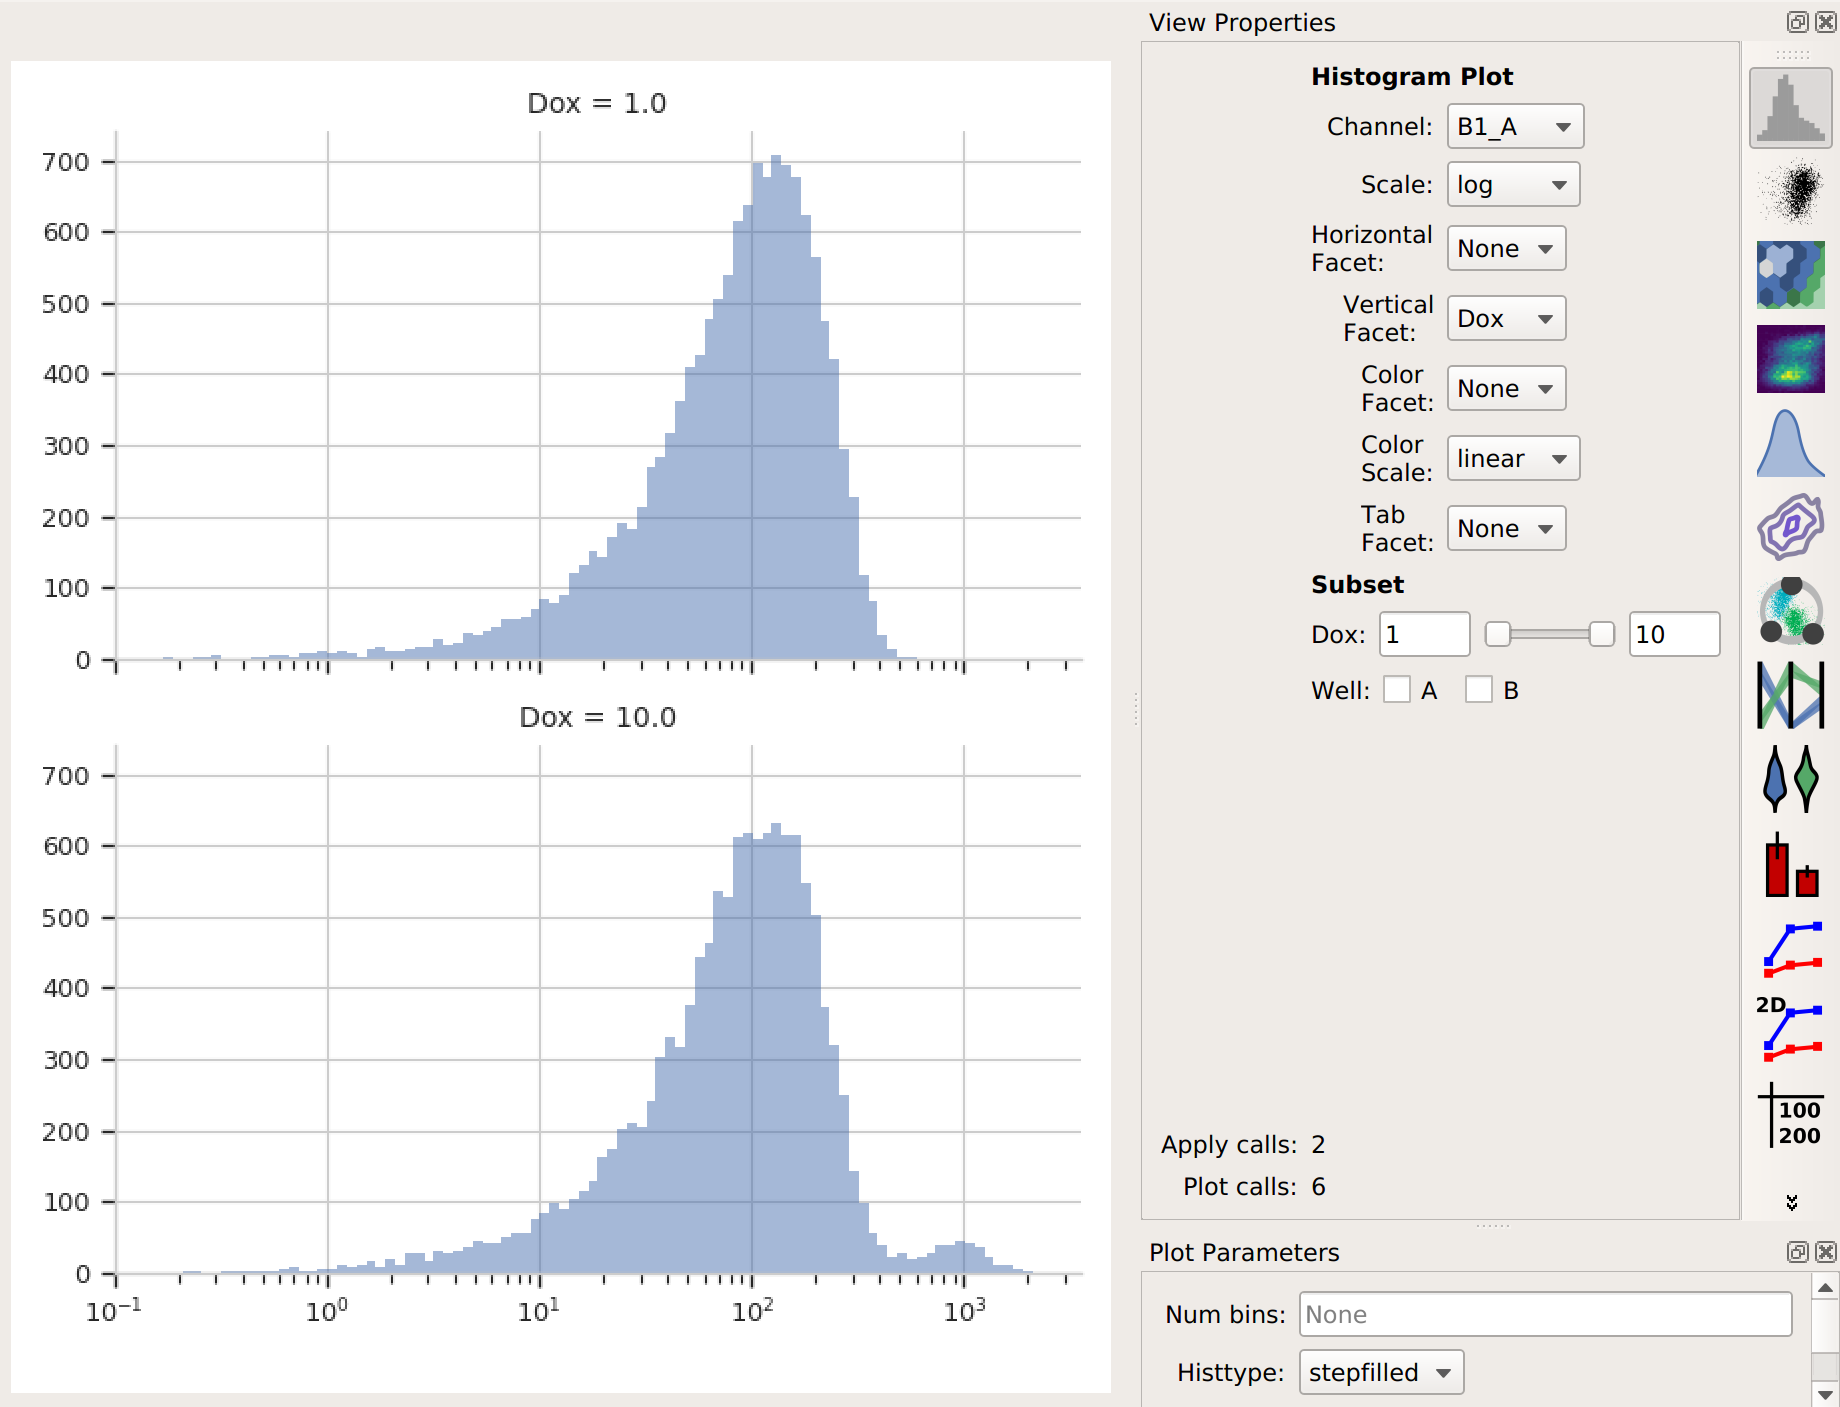
Create the plot you want to save. Here, I’ve got a set of histograms.
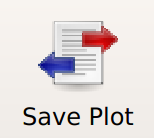
Click the Save Plot button in the top toolbar:
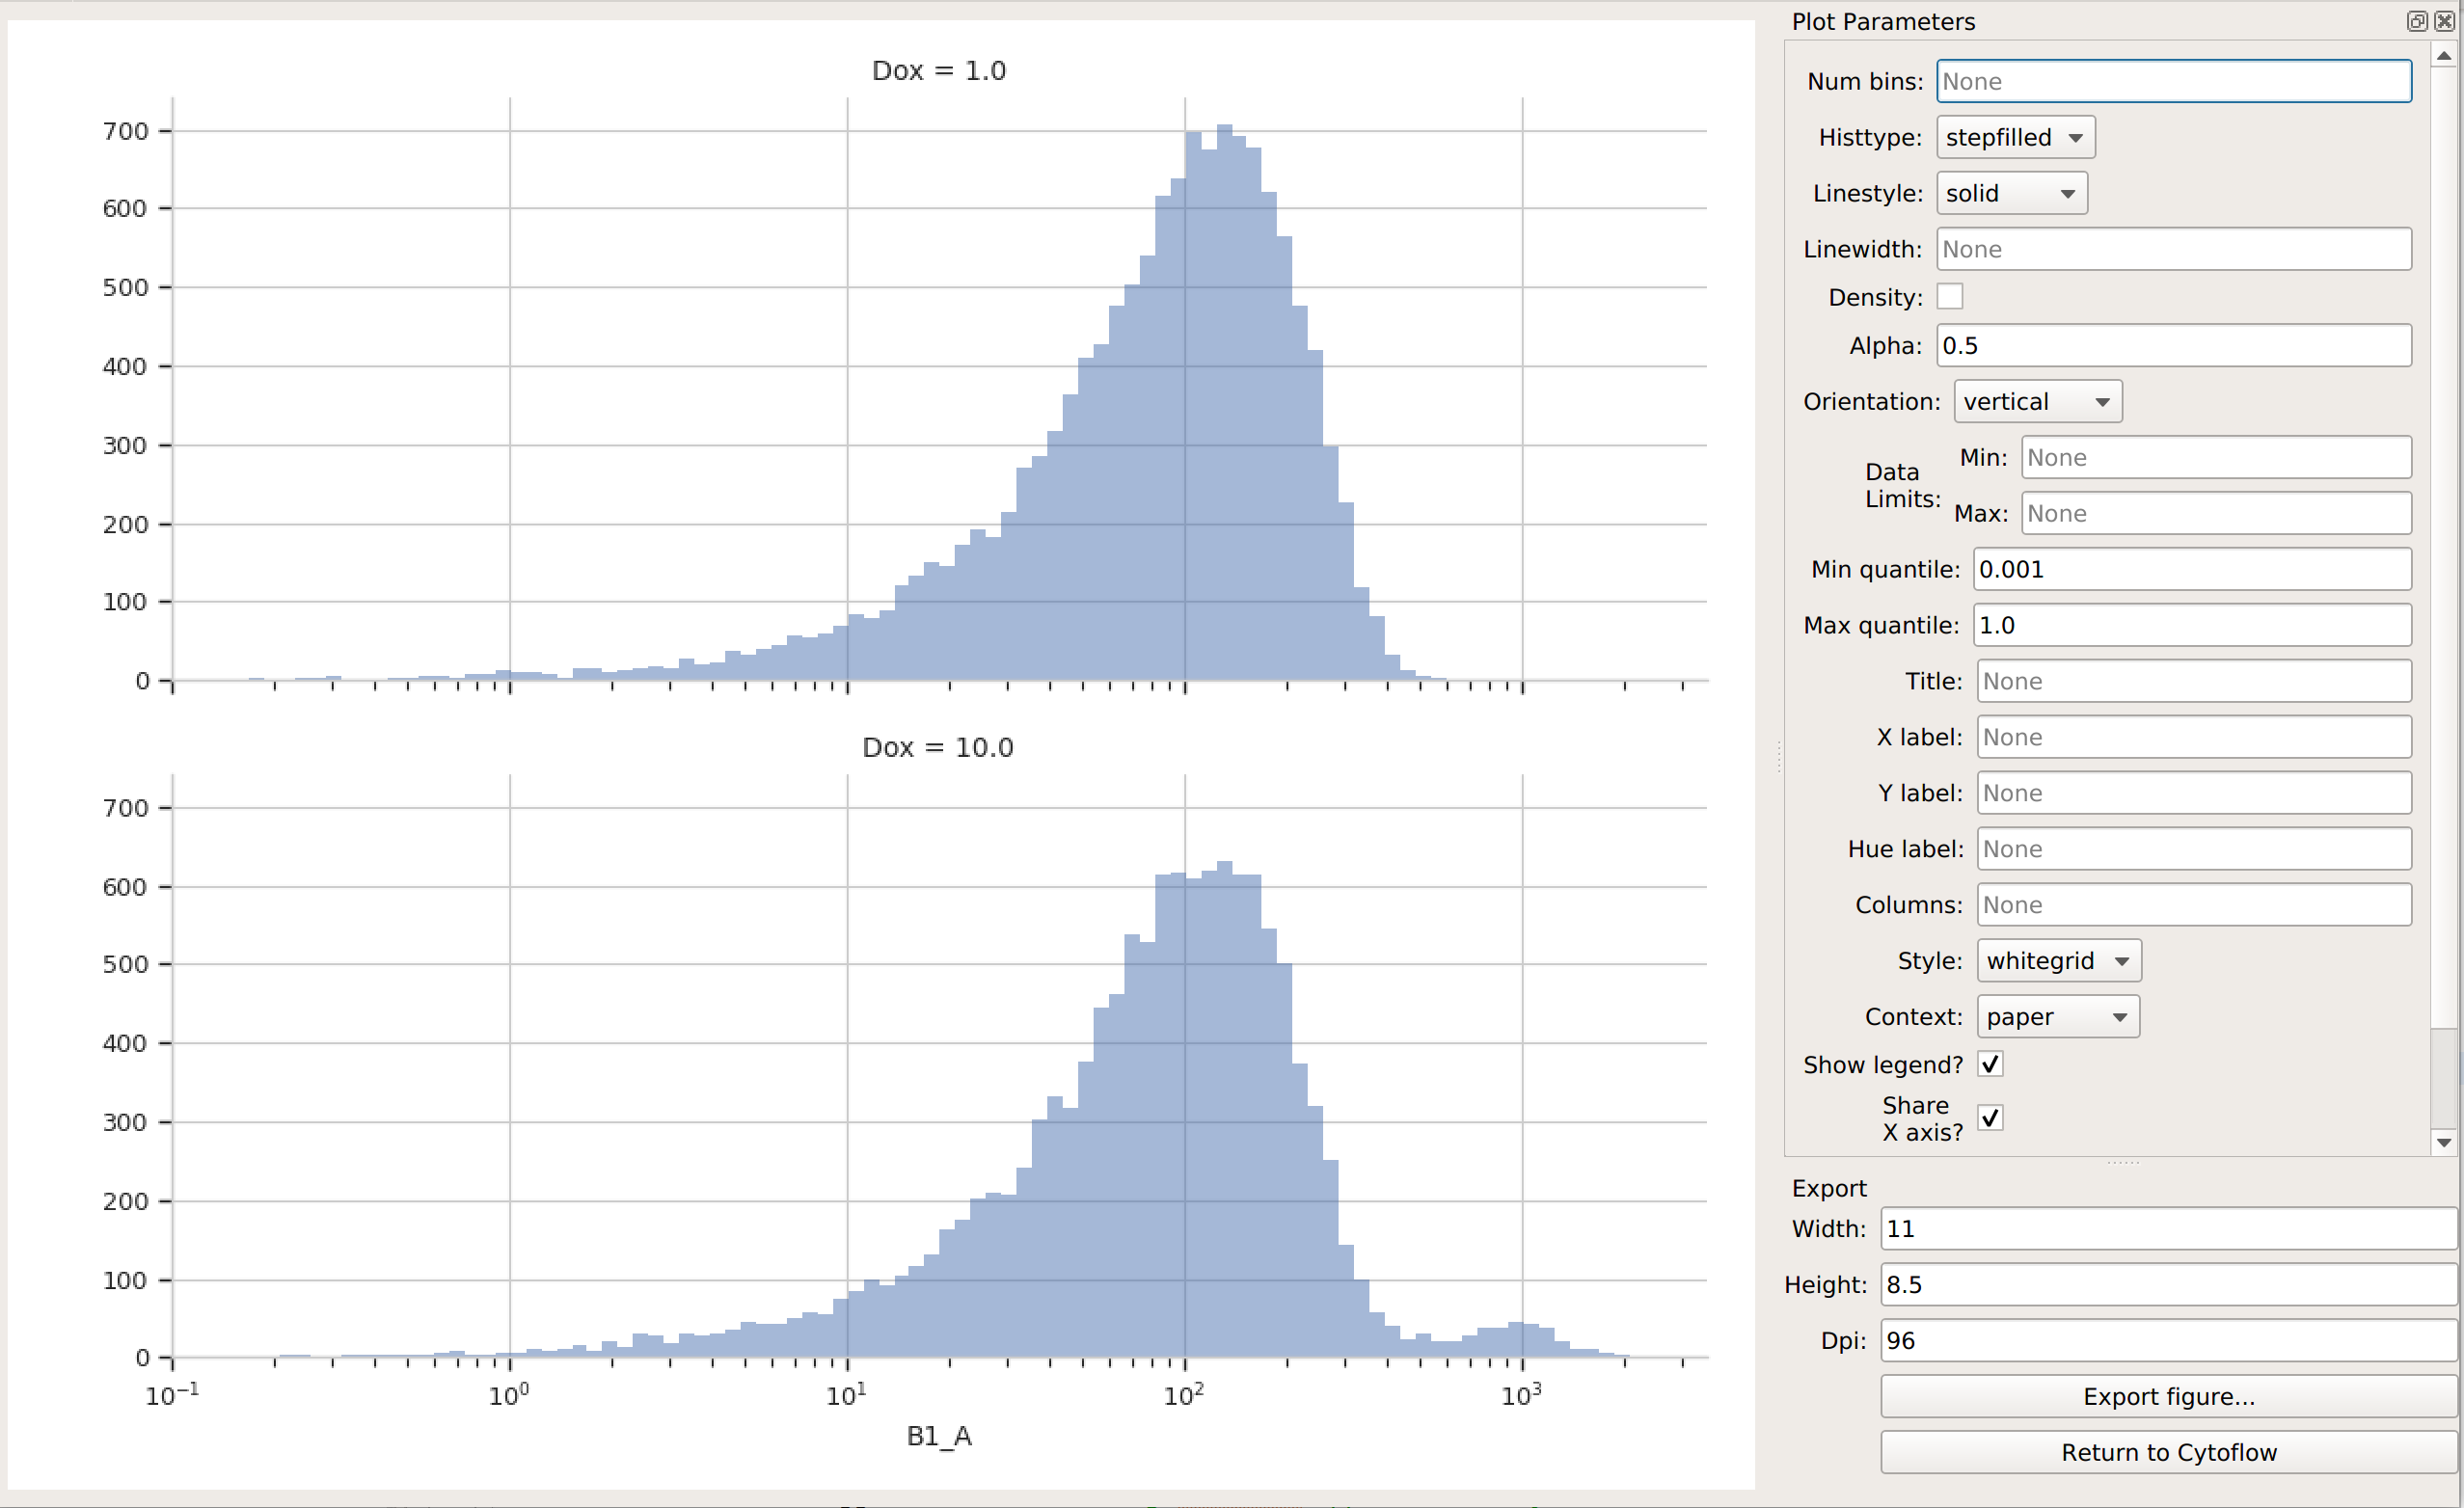
The Save Plot view will open. In the center panel, you’ll see the same plot – but on the right, you’ll see a pane with a bunch of visual style options you can adjust. (The eagle-eyed among you will recognize this as the same panel that shows up below the view parameters pane in the main application.)
Adjust the display options to your liking. One particular one to pay attention to is the Context setting, which changes the relative size of the annotations (axes, labels, legend, etc) relative to the main plot. Here, I’ve changed it to talk and set the plot to a horizontal layout instead of a vertical one.
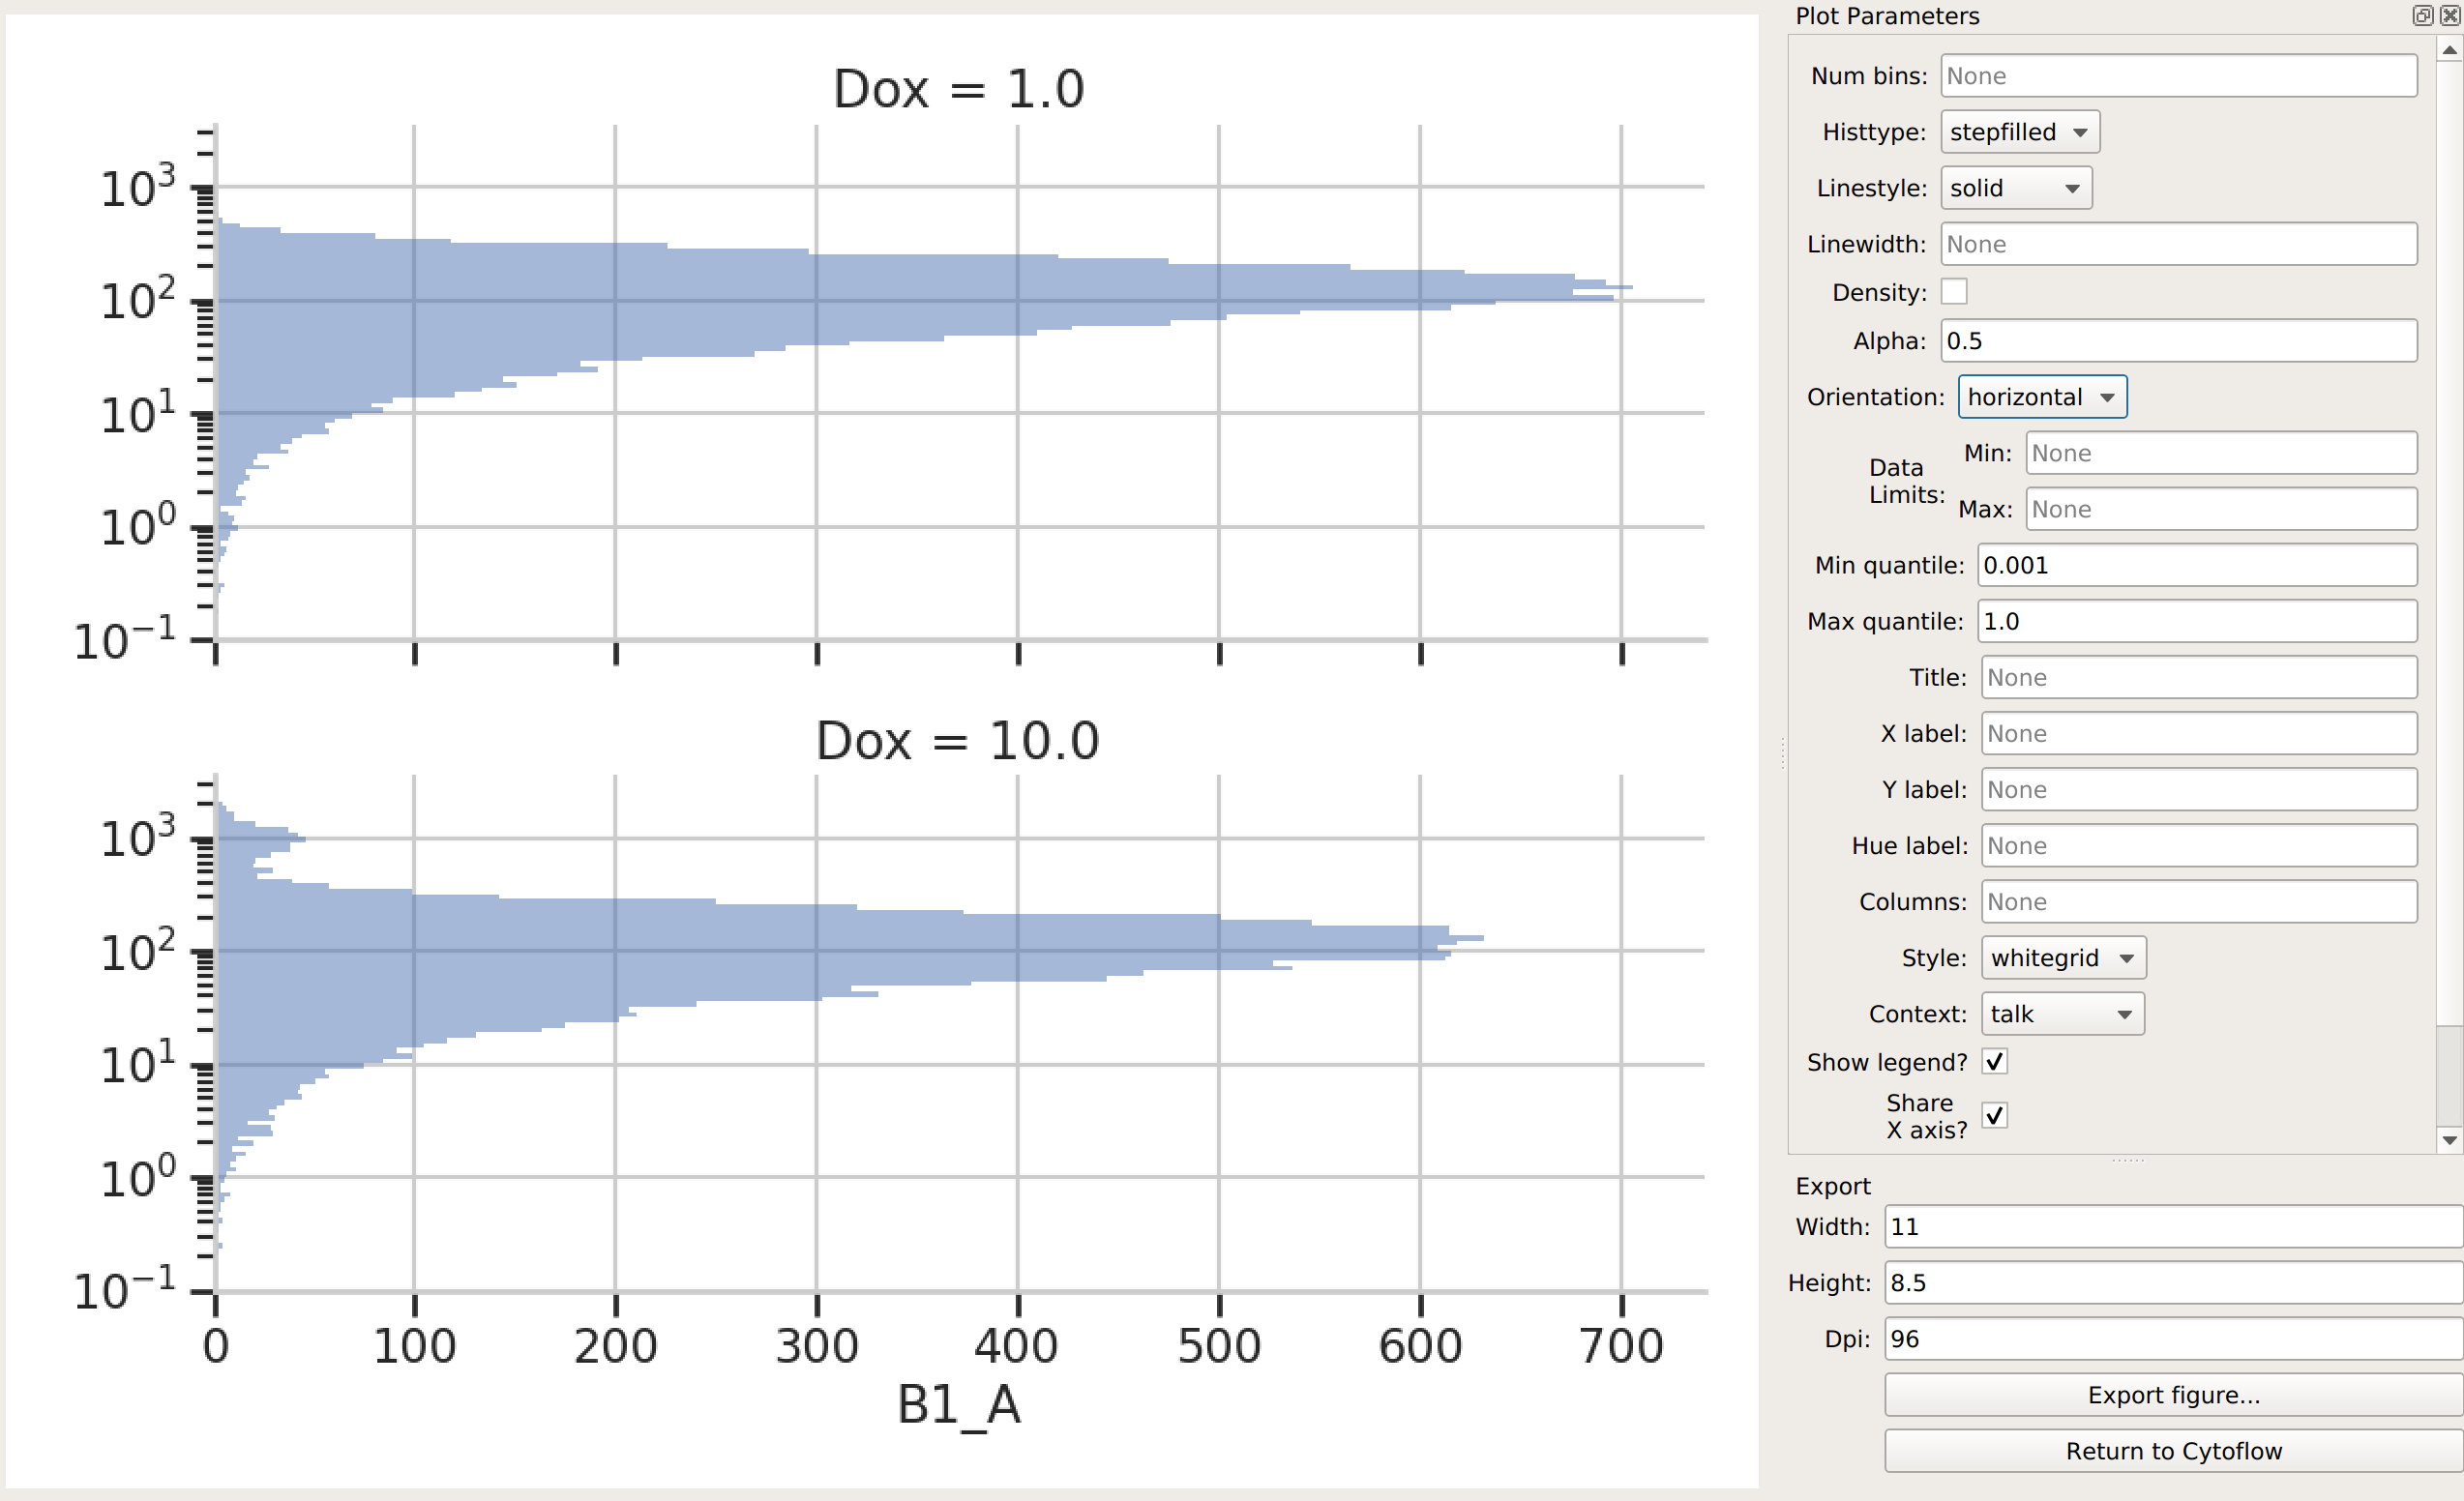
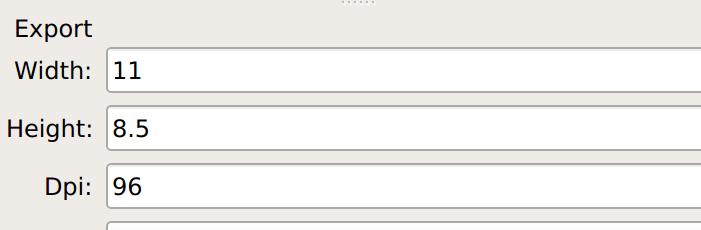
Set the width, height, and resolution of the final image. (Width and height are in inches, and resolution is in DPI – dots per inch.)
Click Export figure… to open your system’s usual Save As dialog box. Pay particular attention to the file type – it’s here where you can choose to save as, say, a PNG or a PDF or a TIFF. Which formats are available to you are system-dependent, but if you need a raster image (to put in a talk, for example), I suggest PNG, while if you need a vector image (to submit with a manuscript, for example), I suggest PDF or EPS.
Once you’re done, click Return to Cytoflow to return to the main application.