Tutorial: Synthetic Gene Logic Network
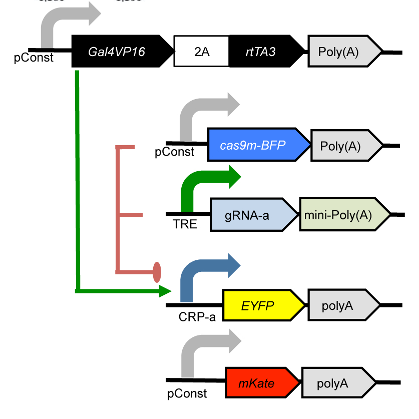
This example reproduces Figure 2, part (a), from Kiani et al, Nature Methods 11: 723 (2014). This experiment uses a dCas9 fusion to repress the output of a yellow fluorescent reporter. The dCas9 is directed to the repressible promoter by a guide RNA under the control of rtTA3, a transcriptional activator controlled with the small molecule inducer doxycycline (Dox).
The plasmids that were co-transfected are shown below (reproduced from the above publication’s Supplementary Figure 6a.)
If you’d like to follow along, you can do so by downloading one of the cytoflow-#####-examples-advanced.zip files from the Cytoflow releases page on GitHub. The files are in the kiani/ subdirectory.
Warning
This is a pretty big data set; on modest computers, the operations can take quite some time to complete. Be patient!
Import the data
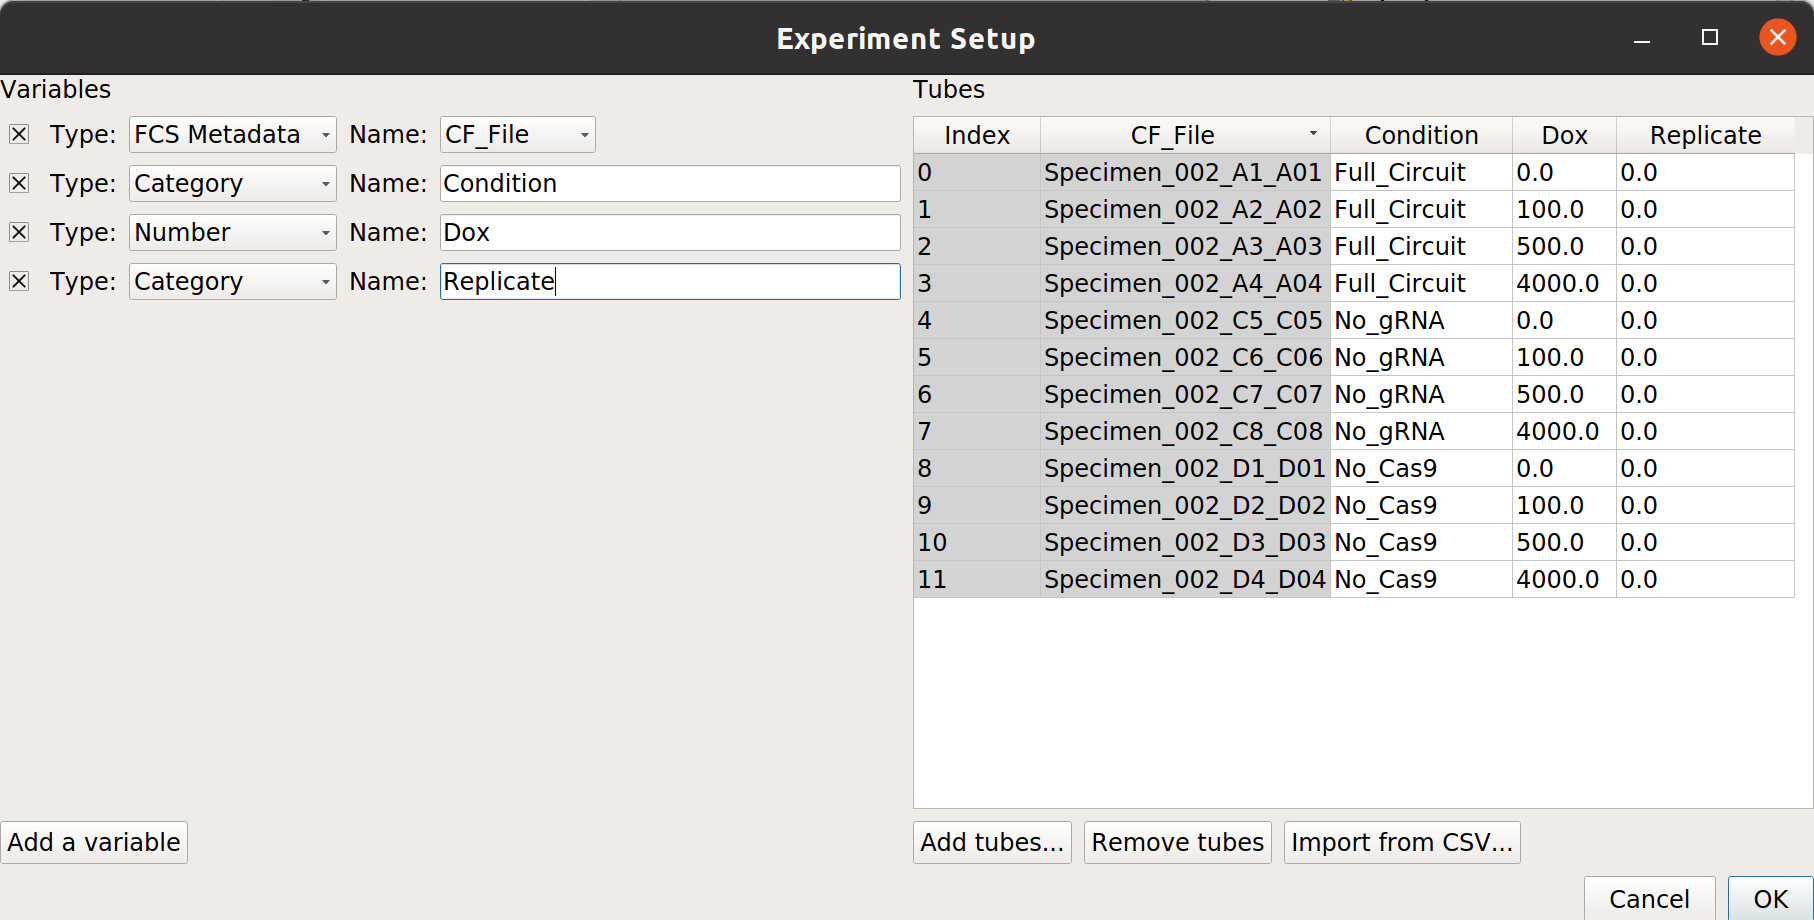
Start Cytoflow. Under the Import Data operation, choose Set up experiment…
Add three variables, Condition and Dox, and Replicate. Make Condition and Replicate Category*s, and make *Dox a Number.
Each replicate is in a separate subdirectory, with identical filenames. Here’s the mapping from filename to conditions for one replicate:
Note
There are a lot of rows in this table. Two things can make setting up these kinds of experiments easier. First, if you already have the details in a table, you can import that table by following the instructions at HOWTO: Import an experiment from a table. And second, you can select multiple cells in the table to edit at once by holding Control or Command and clicking multiple cells.
Warning
It is generally not a good idea to name a variable Time, because most flow cytometers produce FCS files with a Time “channel” and you can’t re-use those names!
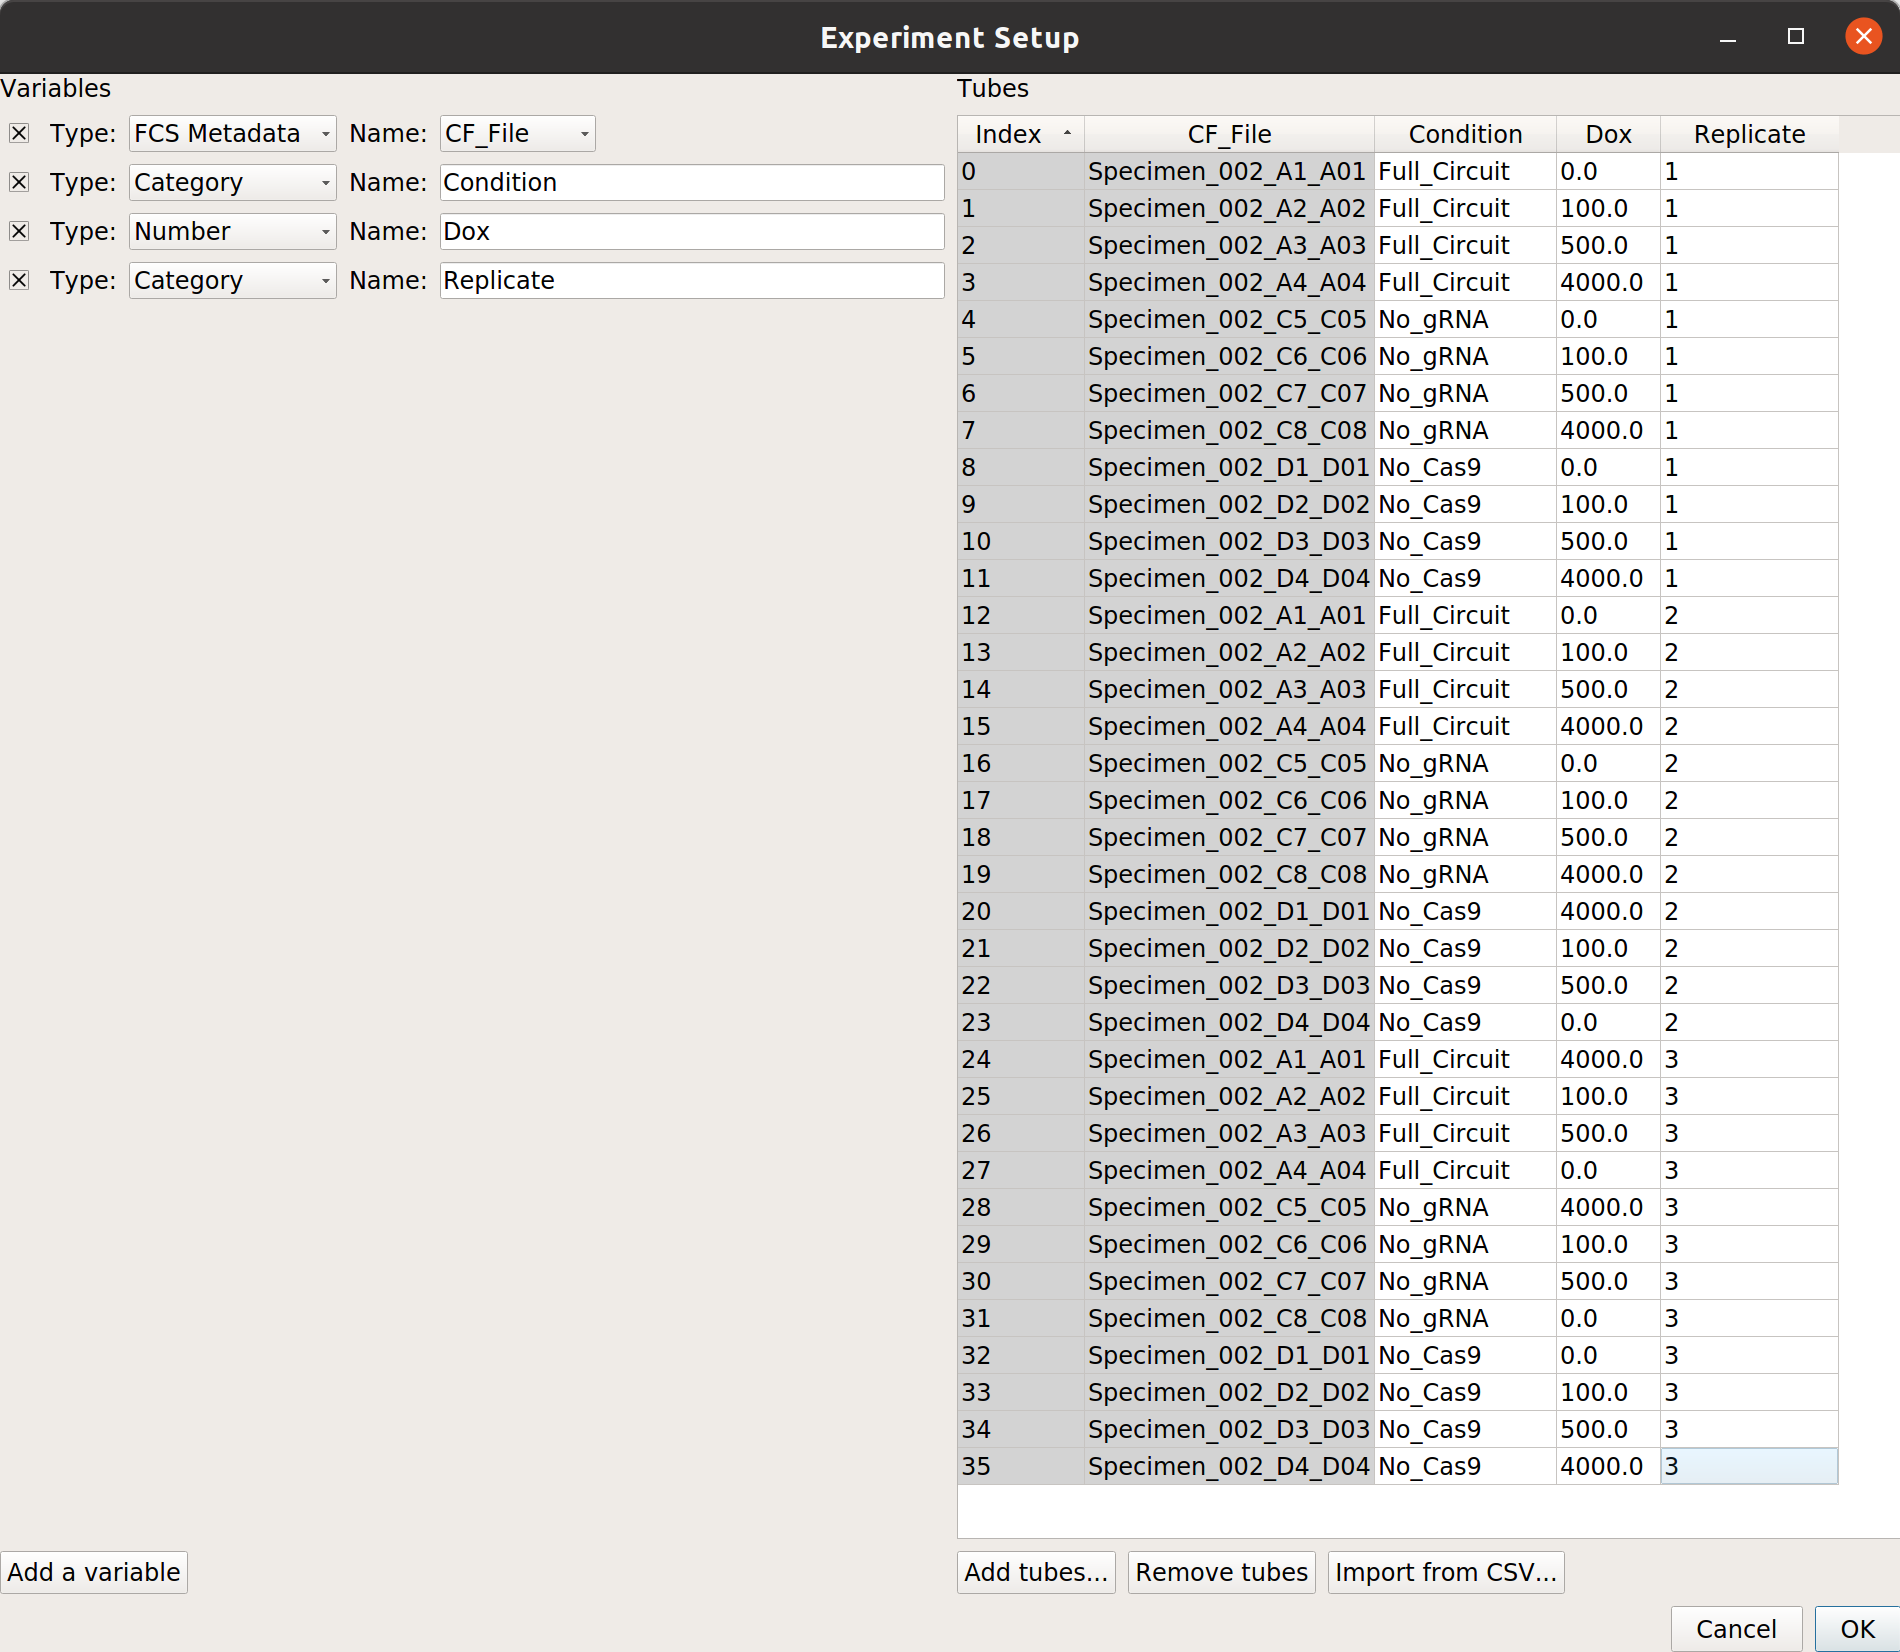
At the end, your table should look like this:
Gate out debris
There’s a lot of data here; let’s use a Density View to look at the FSC-A and SSC-A channels:
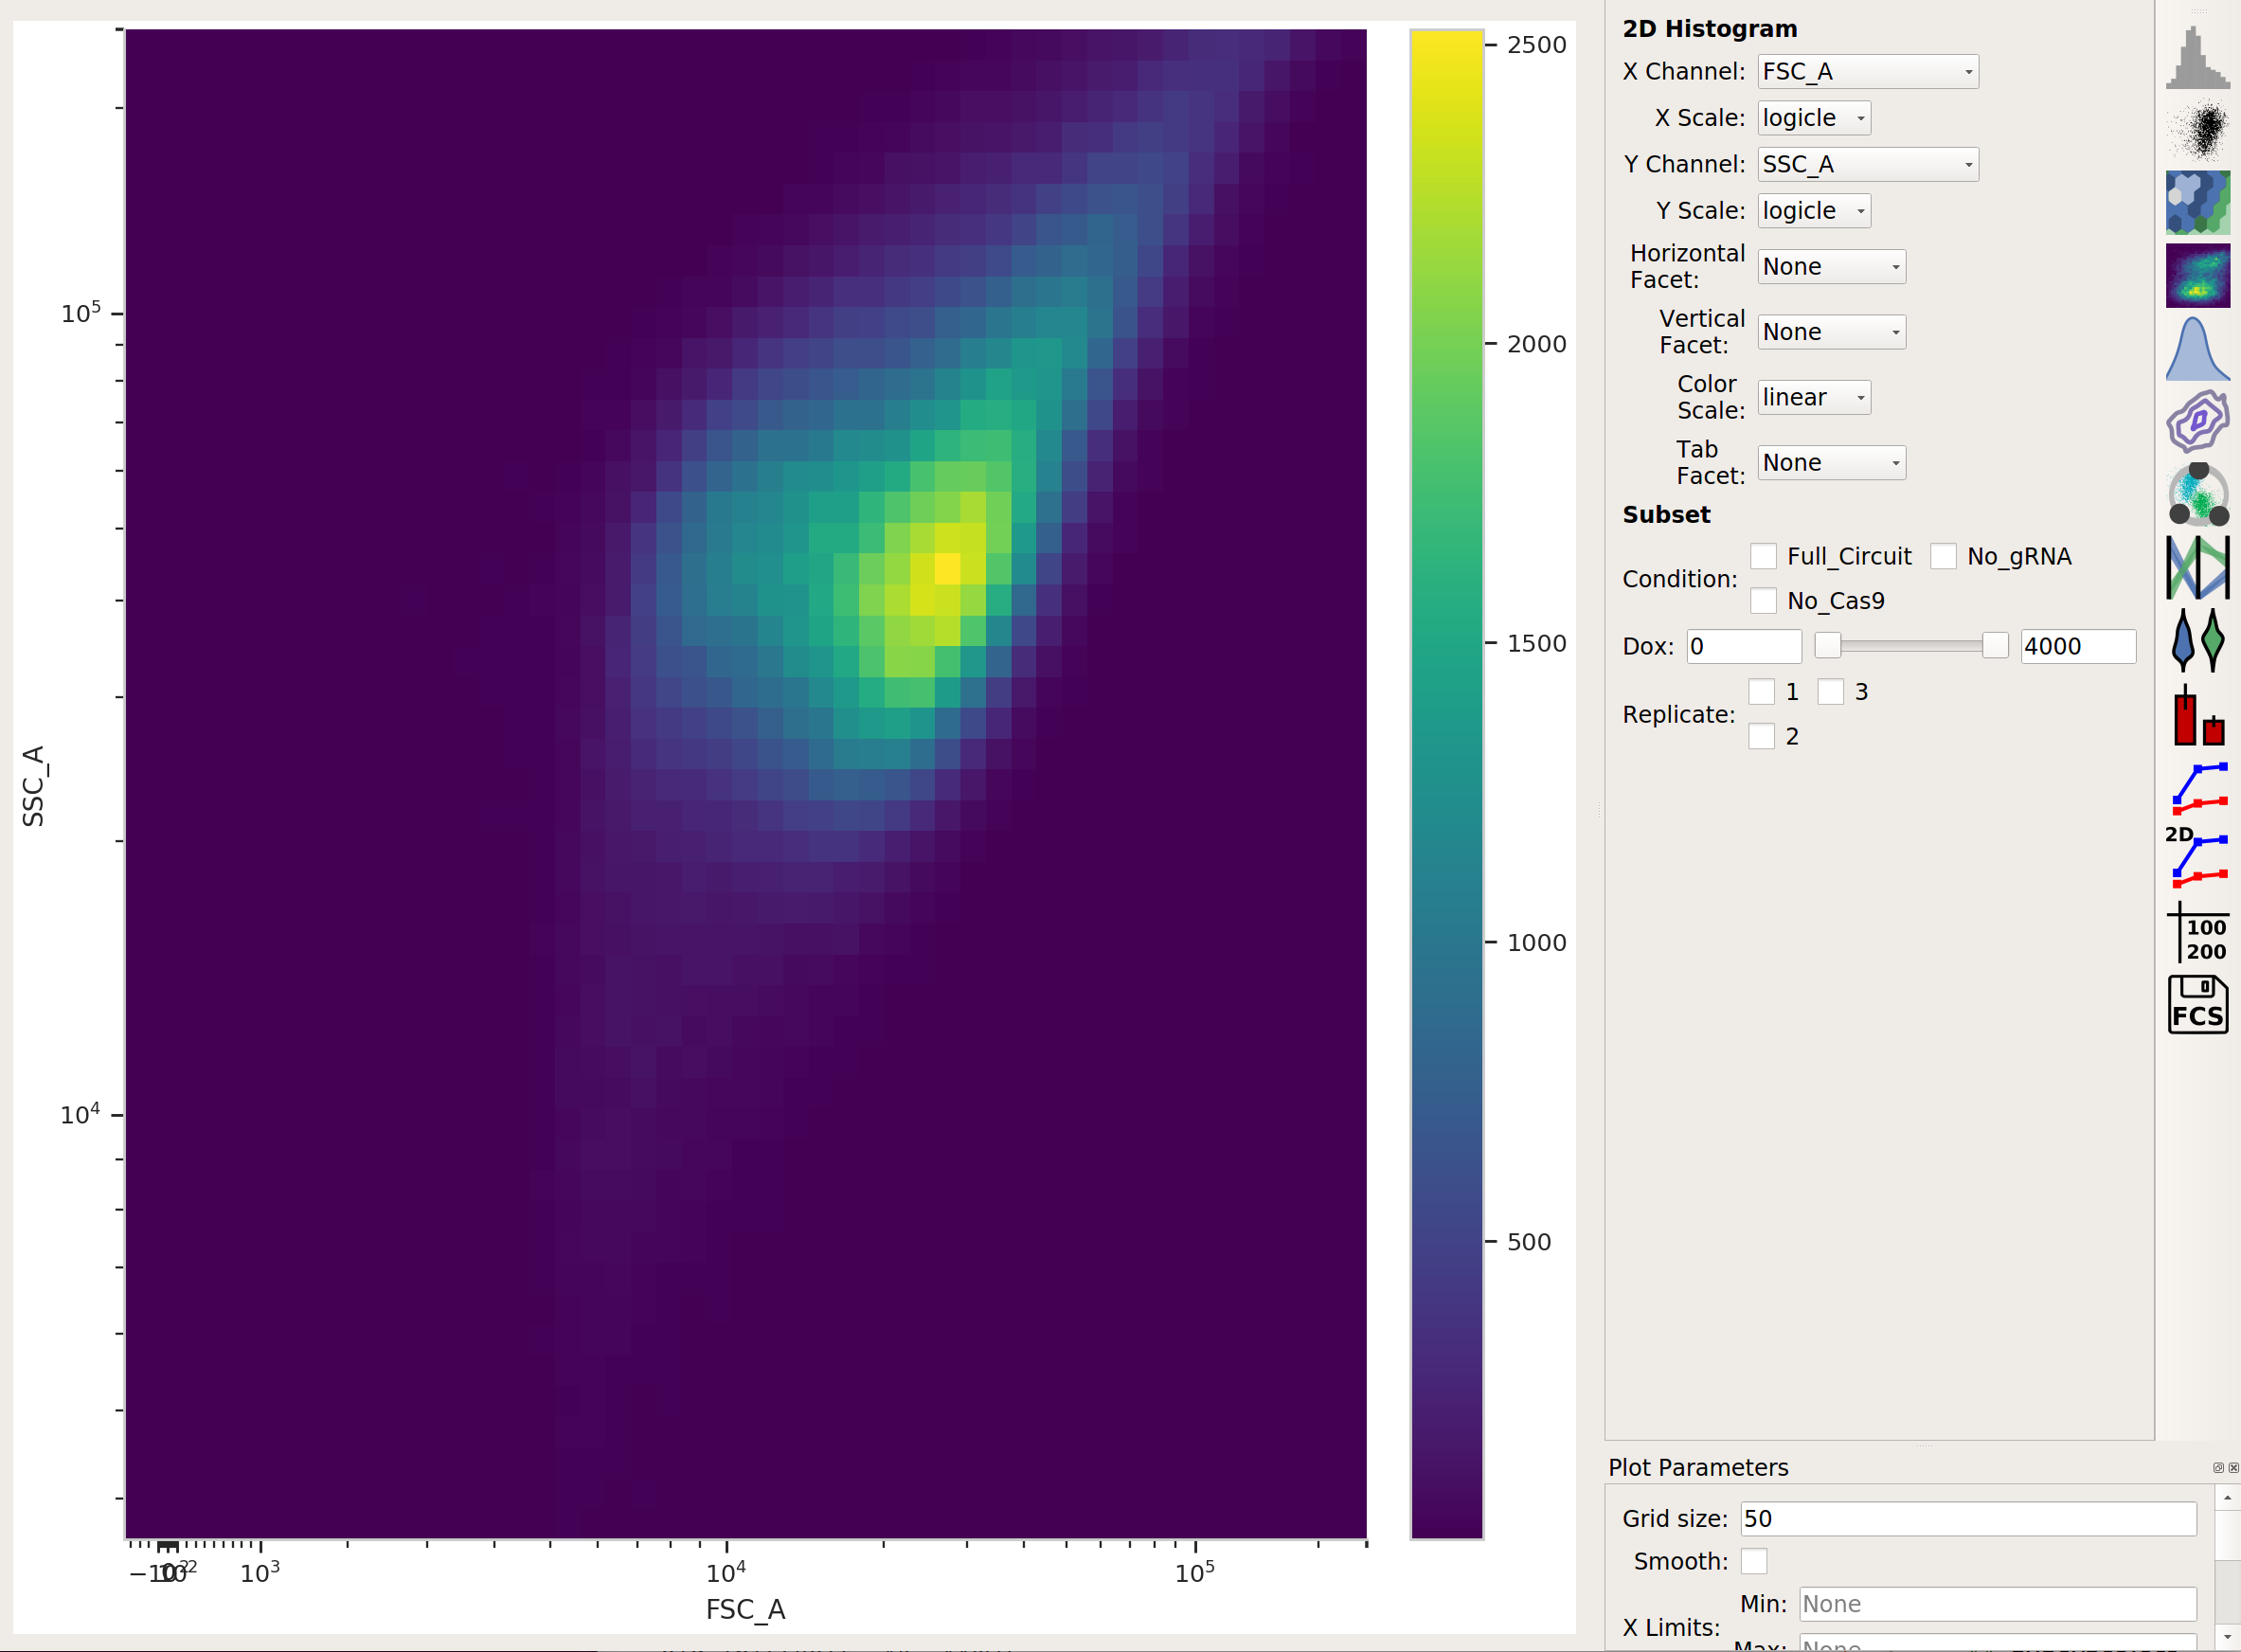
This looks like it’s been pre-gated (ie, there’s not a mixture of populations.) It’s also pushed up against the top axes in both SSC-A and FSC-A, which is a little concerning, but shouldn’t affect our analyses too much.
Select transfected cells
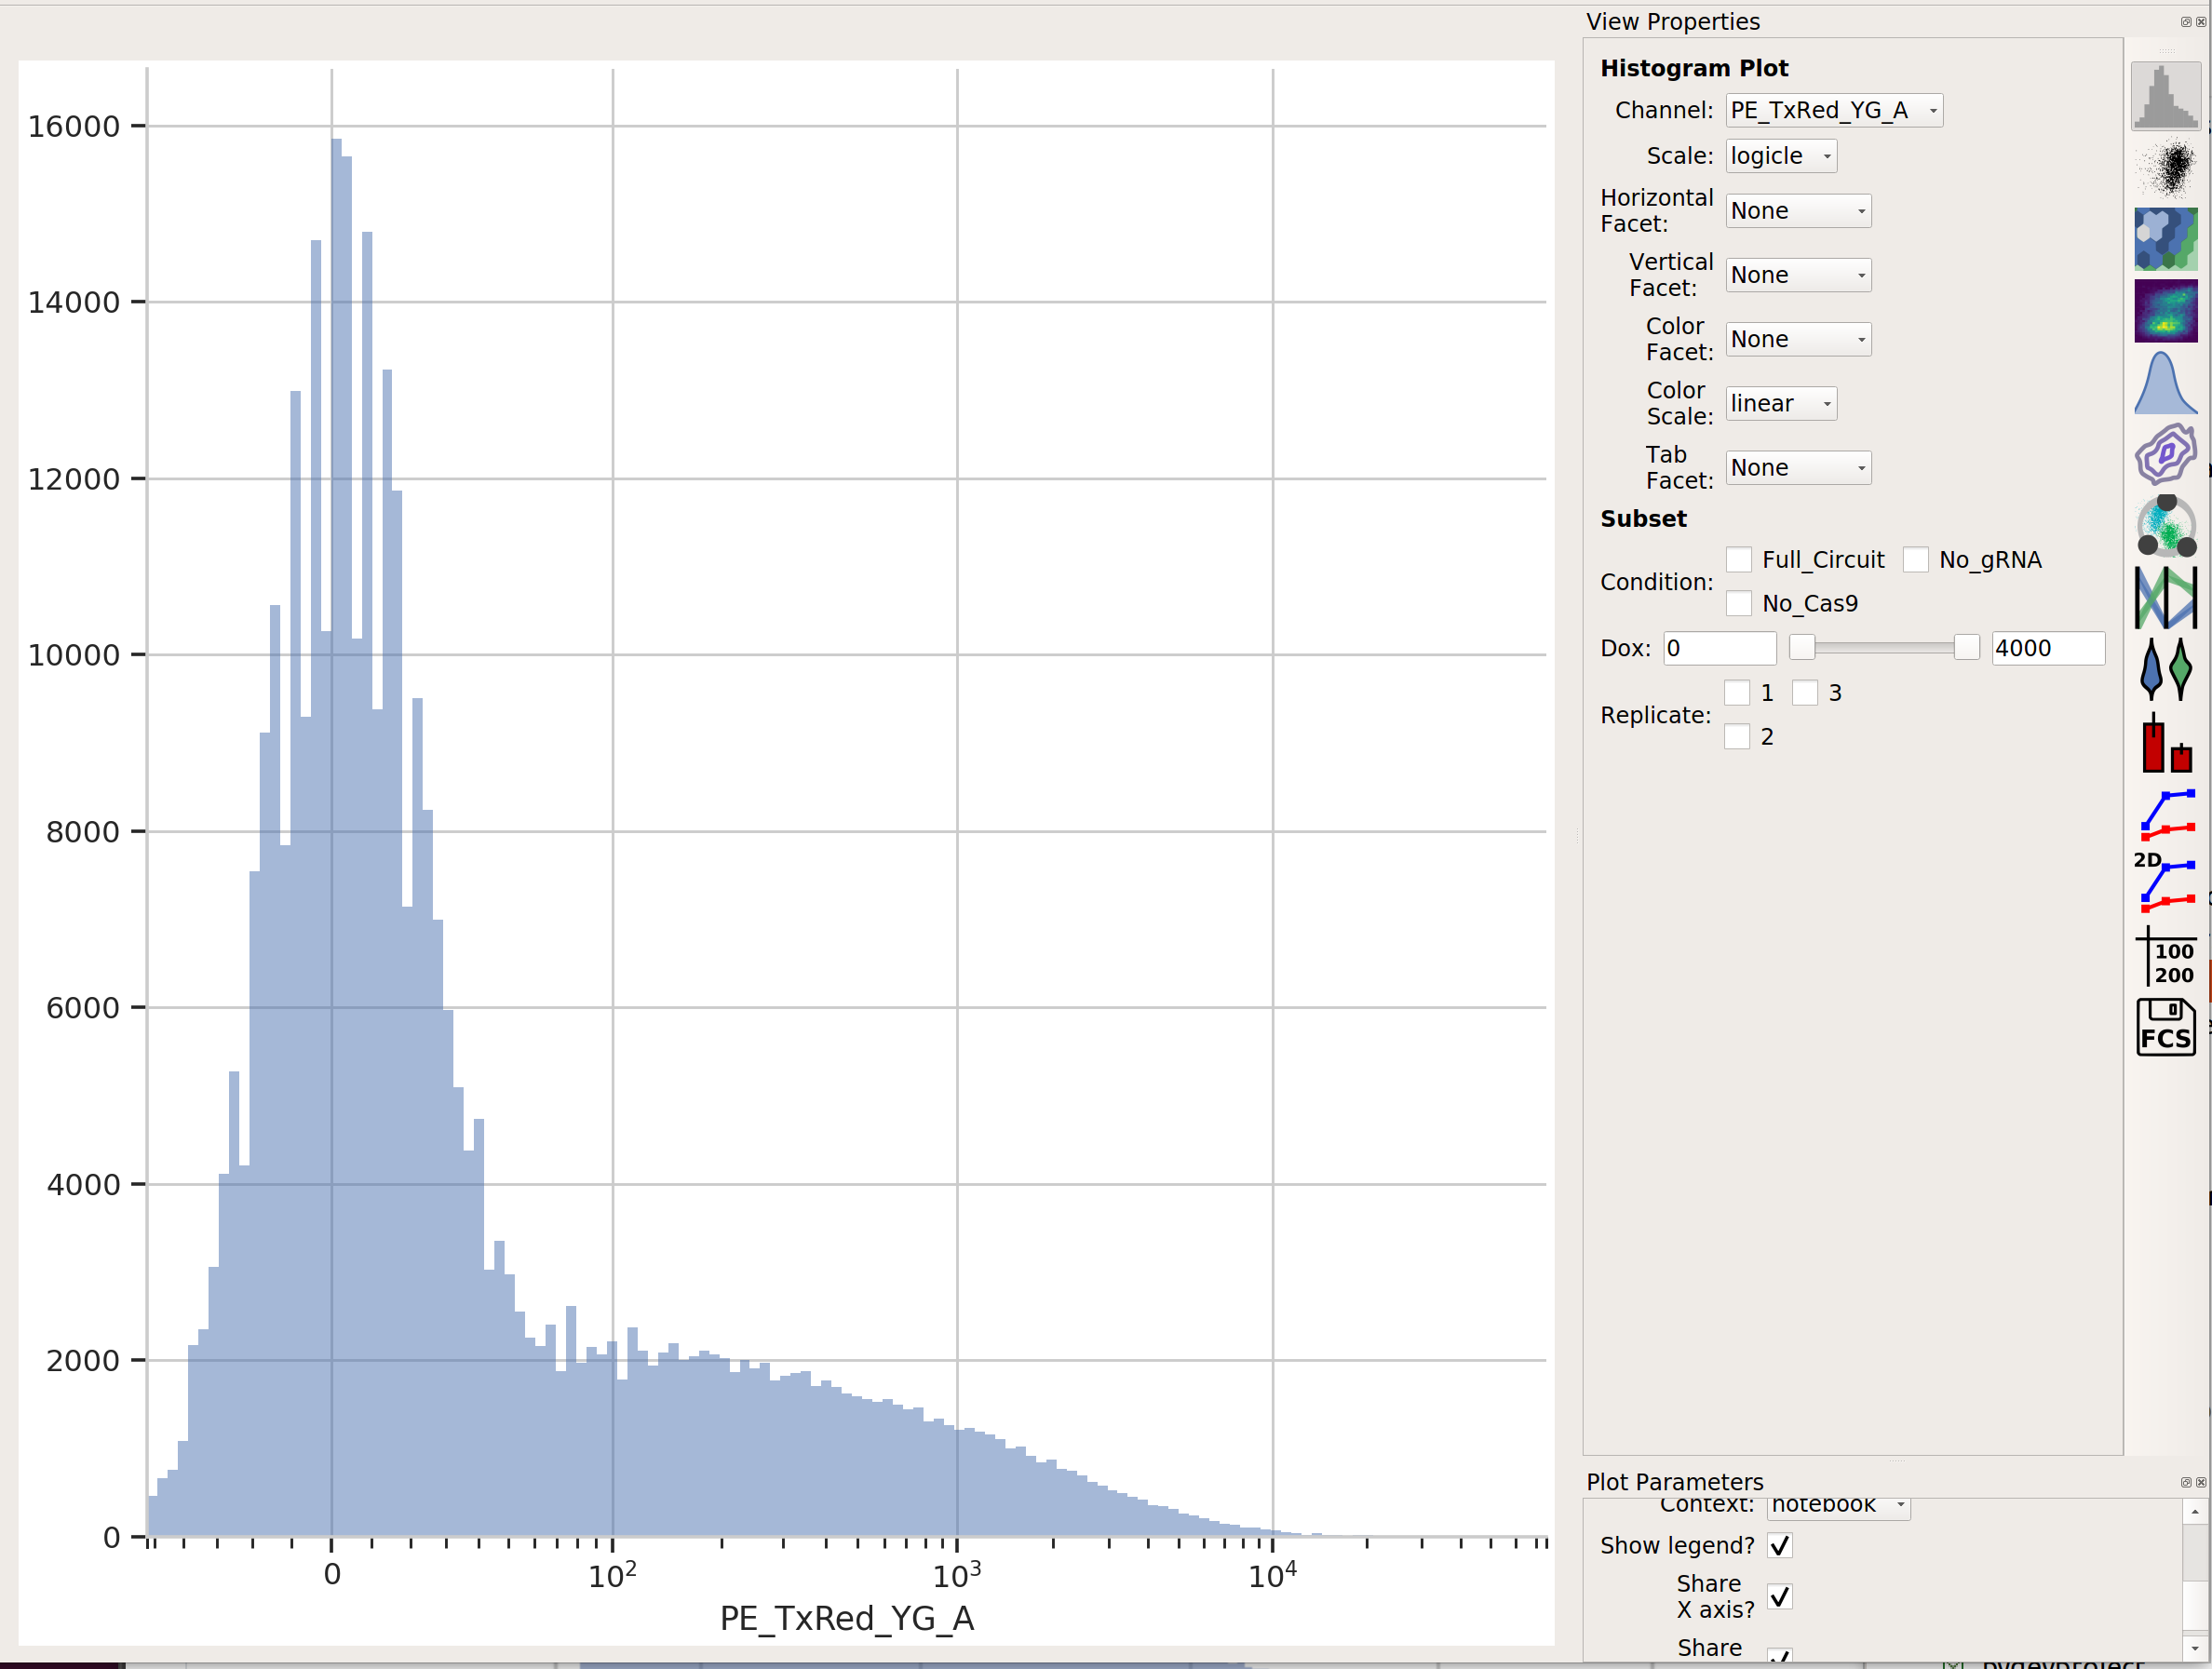
The next thing we usually do is select for positively transfected cells.
mKate is the transfection marker, so look at the red (PE_TxRed_YG_A)
channel:
Let’s fit a mixture-of-gaussians, for a nice principled way of separating the transfected population from the untransfected population.
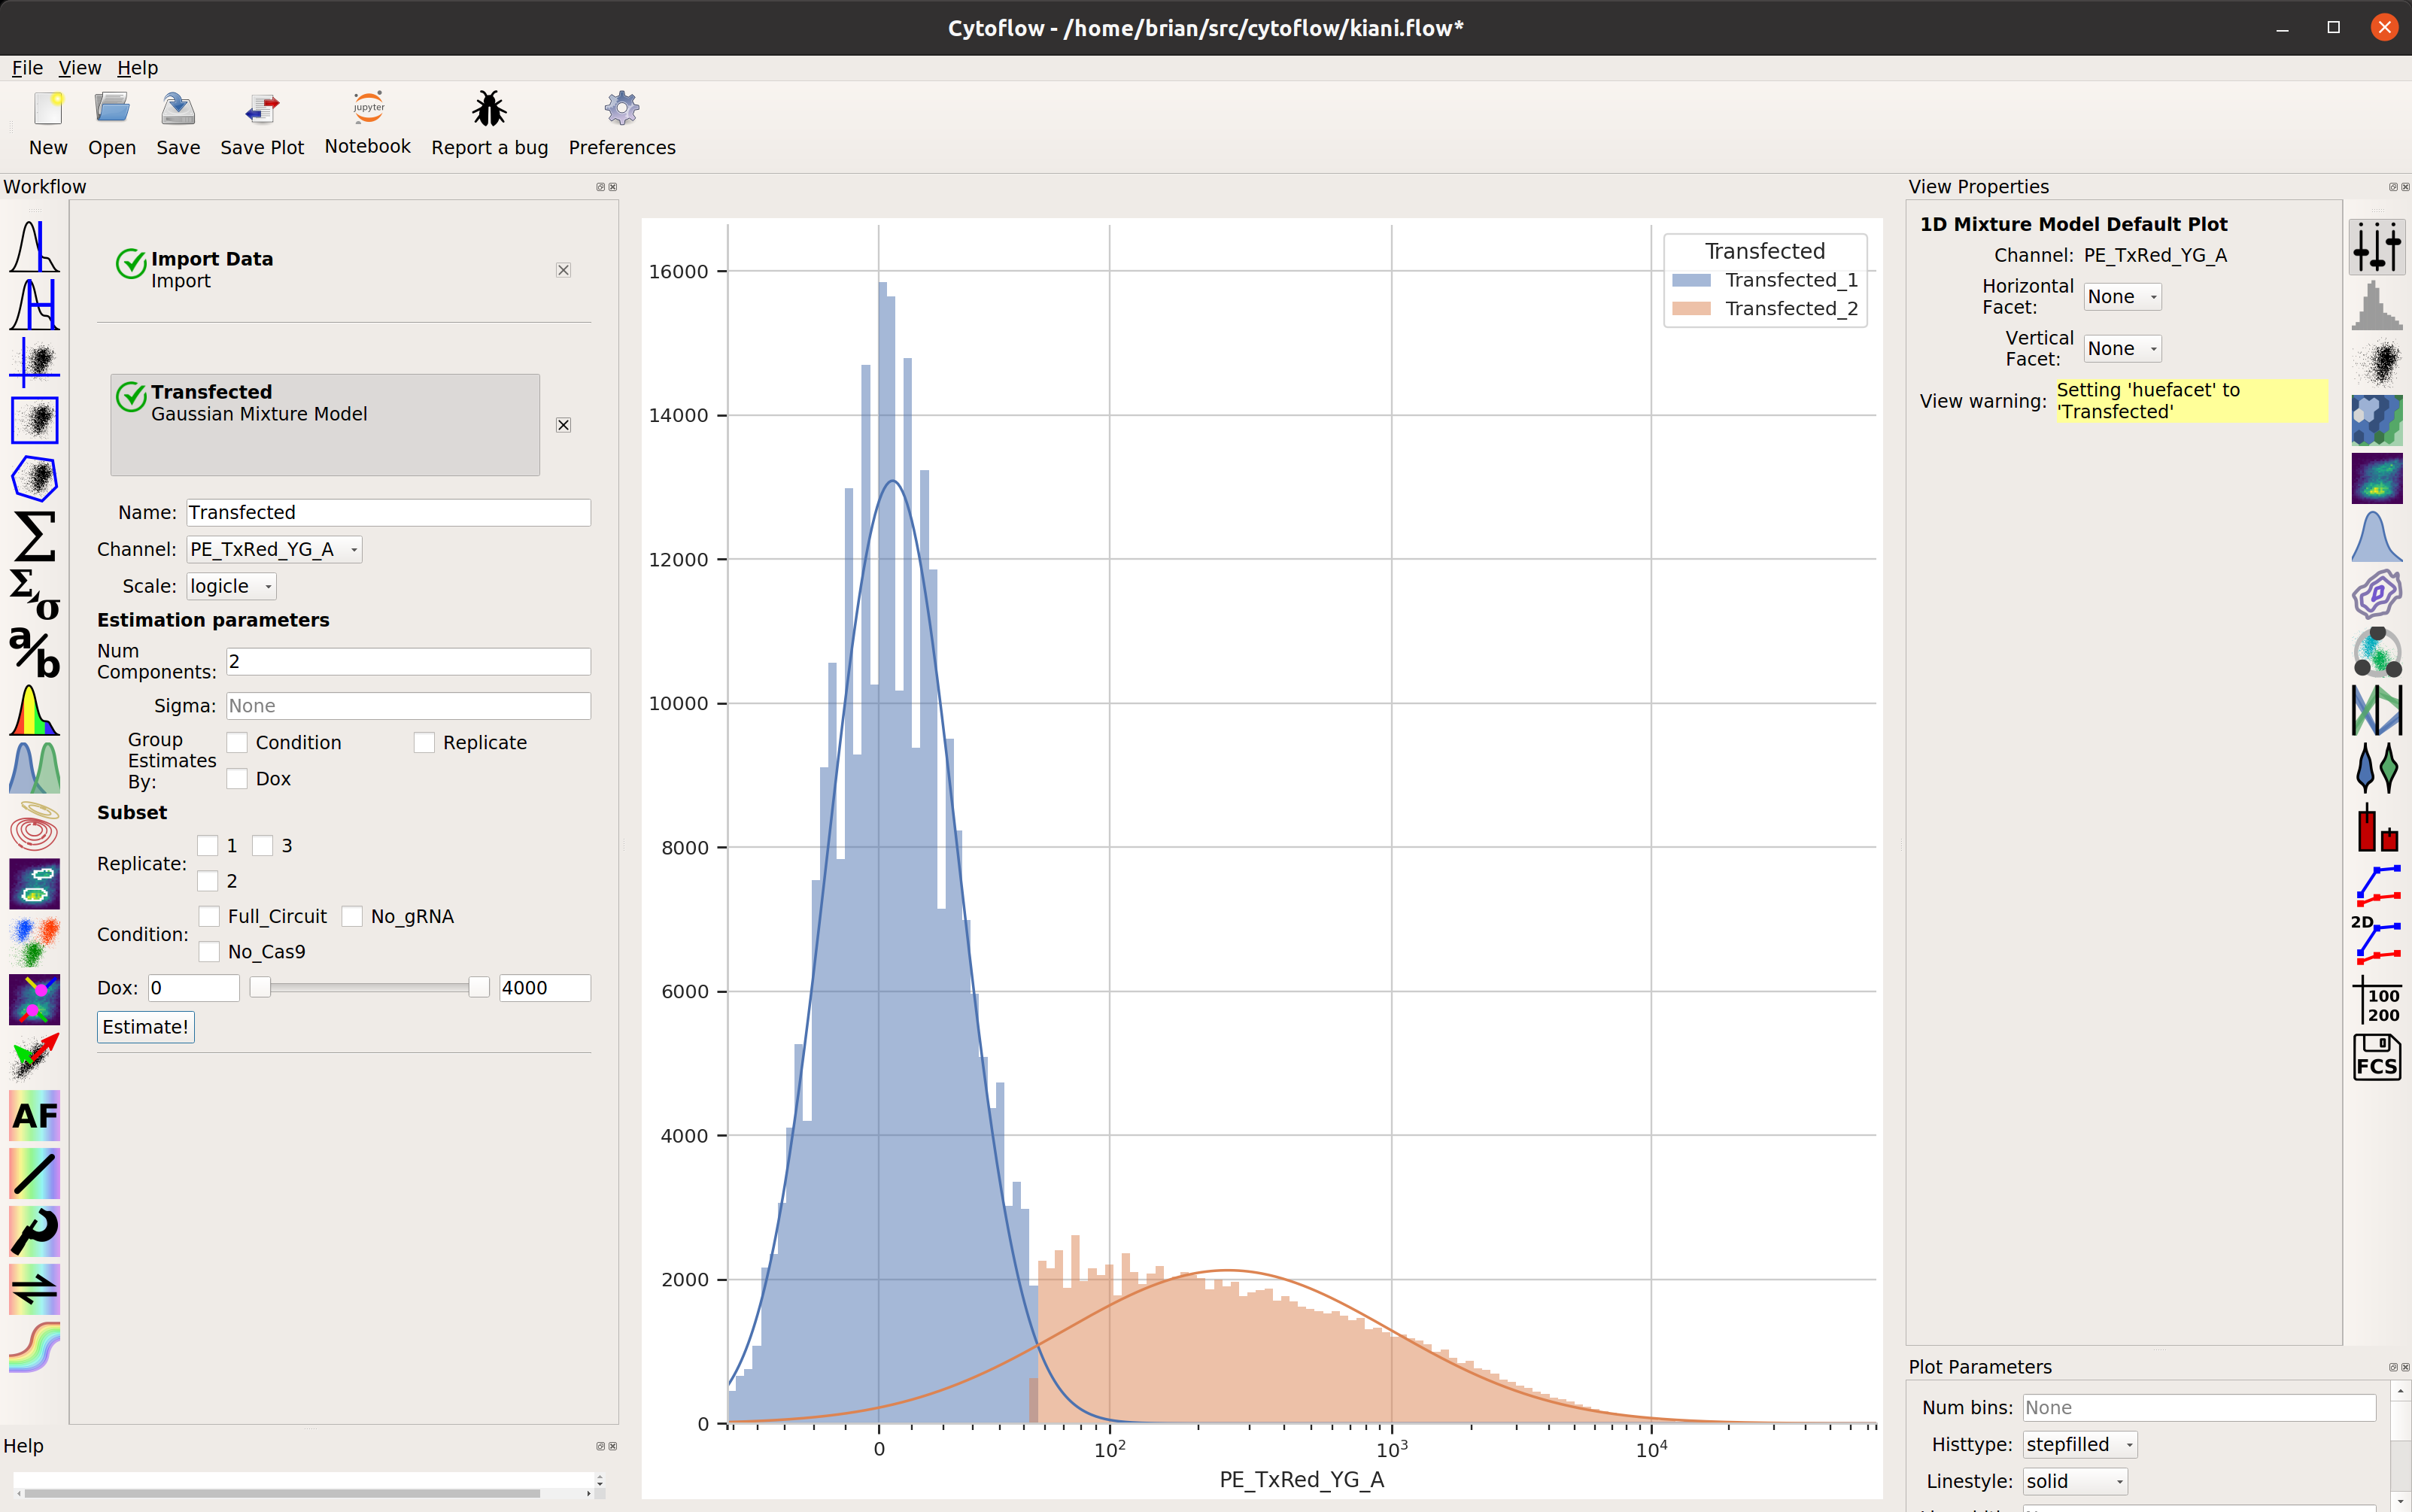
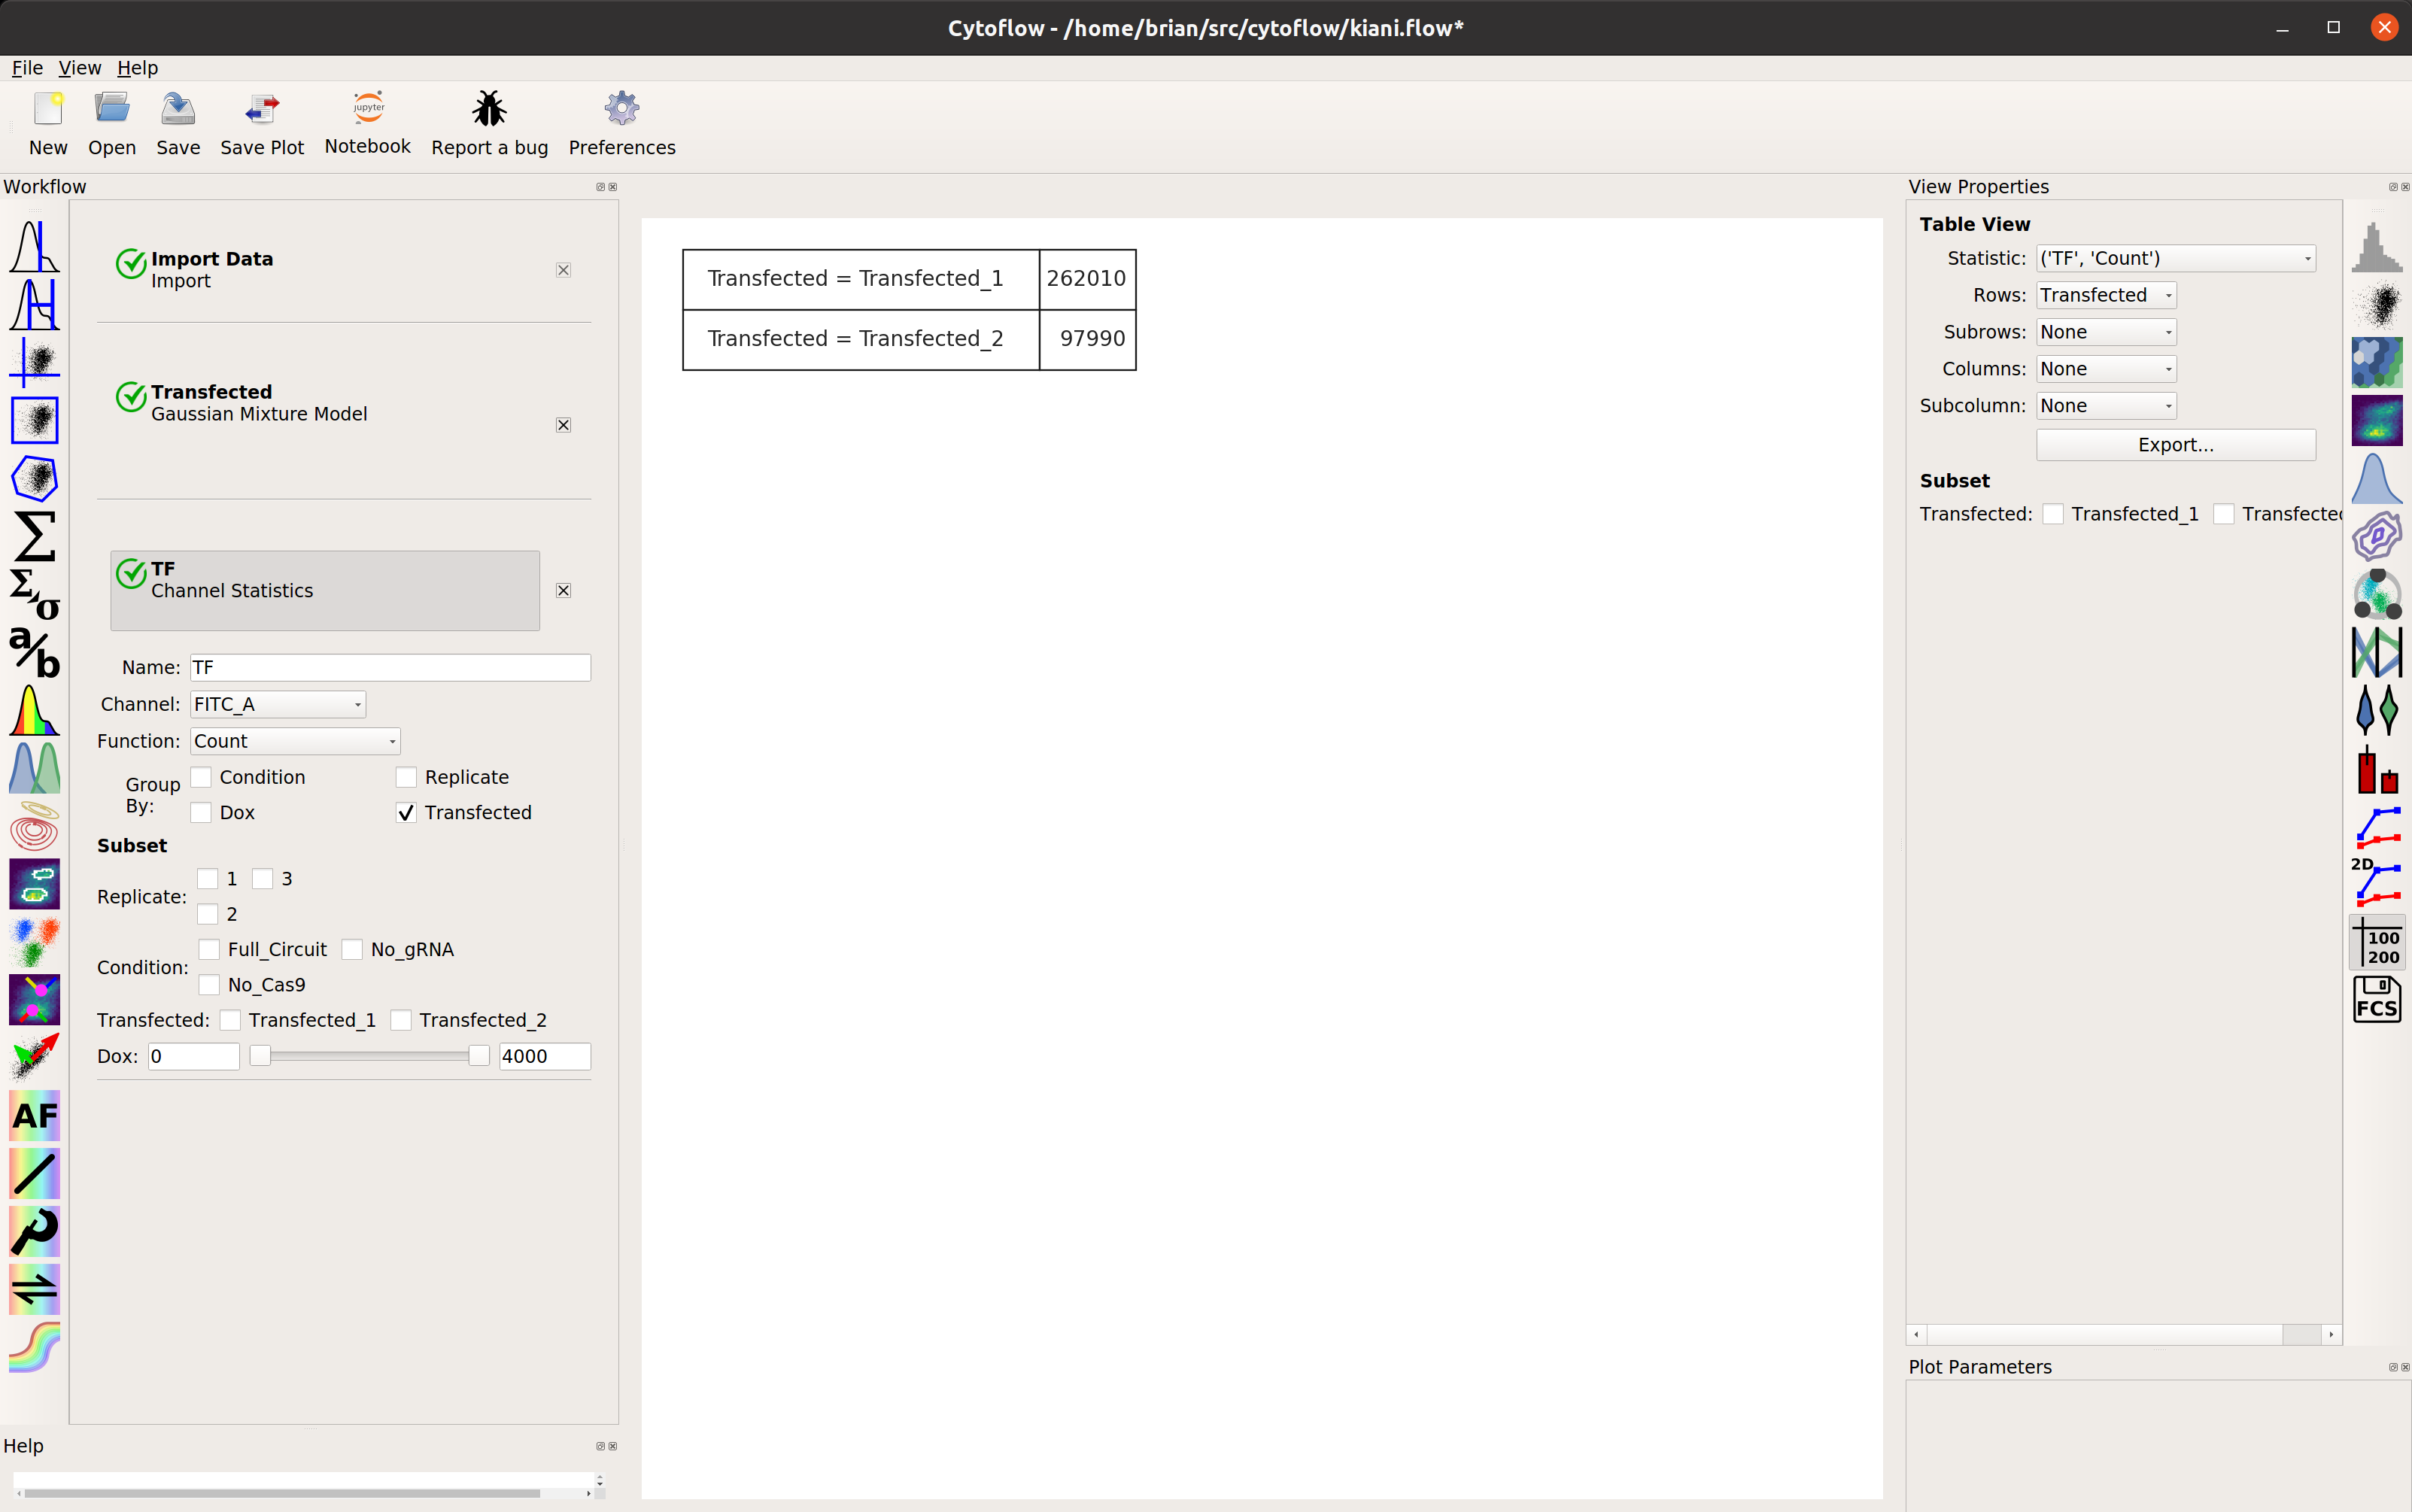
Looks good: the events with Transfected_2 == True are the cells in the
transfected population. Let’s make a statistic to see how many events are in
each population:
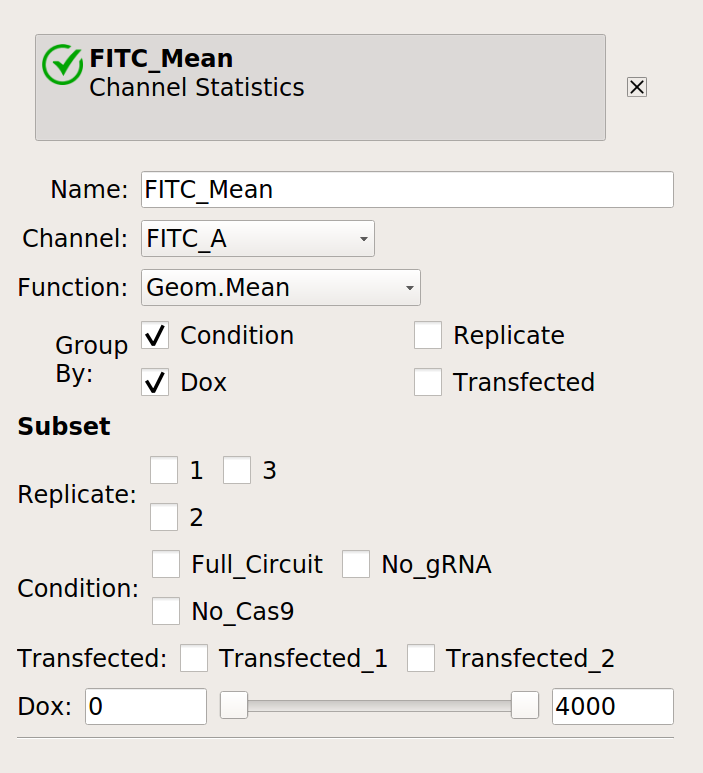
Examine the function of the gene circuit
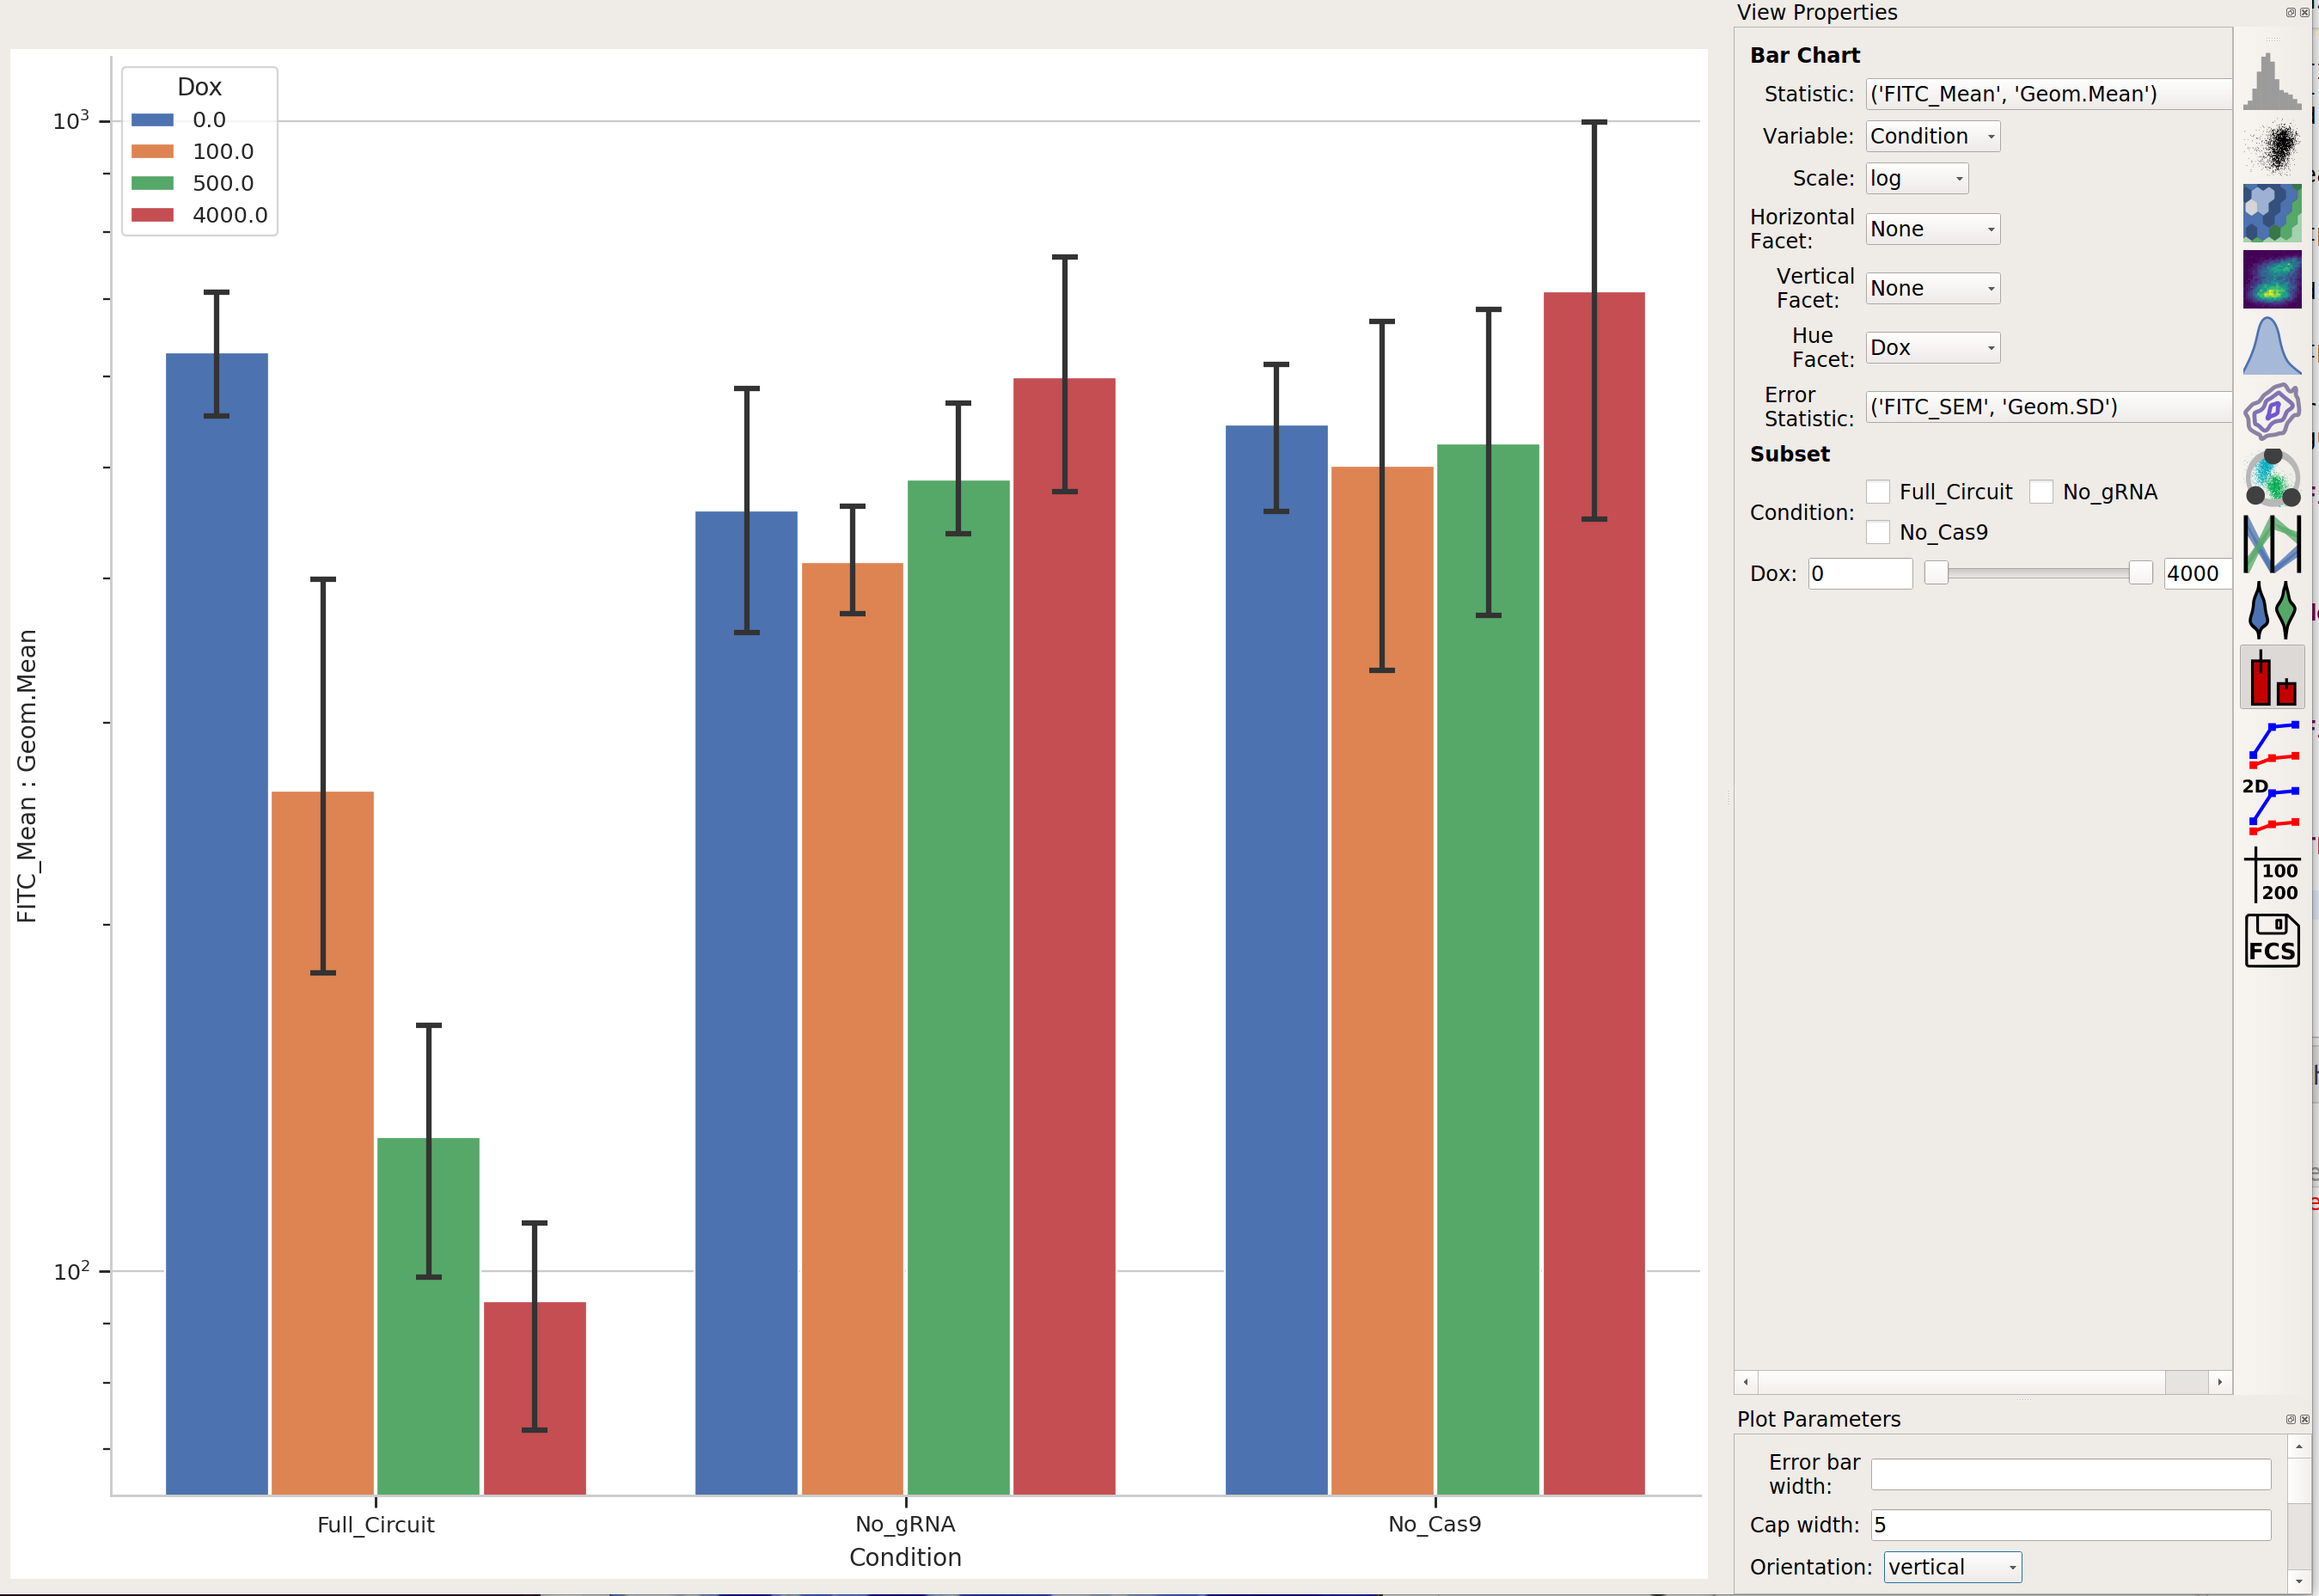
Now, we can reproduce the bar chart in the publication by taking the output
(EYFP, in the FITC-A channel) geometric mean of the positively transfected cells,
split out by condition and Dox. Don’t forget to look at just the transfected
cells (using subset). We’ll compute the geometric mean across circuit and Dox,
and then split it out by replicate so we can compute an SEM.
Please note: This is a terrible place to use error bars. See:
https://www.nature.com/nature/journal/v492/n7428/full/492180a.html
and
http://jcb.rupress.org/content/177/1/7
for the reason why. I’m using them here to demonstrate the capability, rather than argue that you should perform your analysis this way.
First, make a statistic with the overall geometric mean (by condition and Dox):
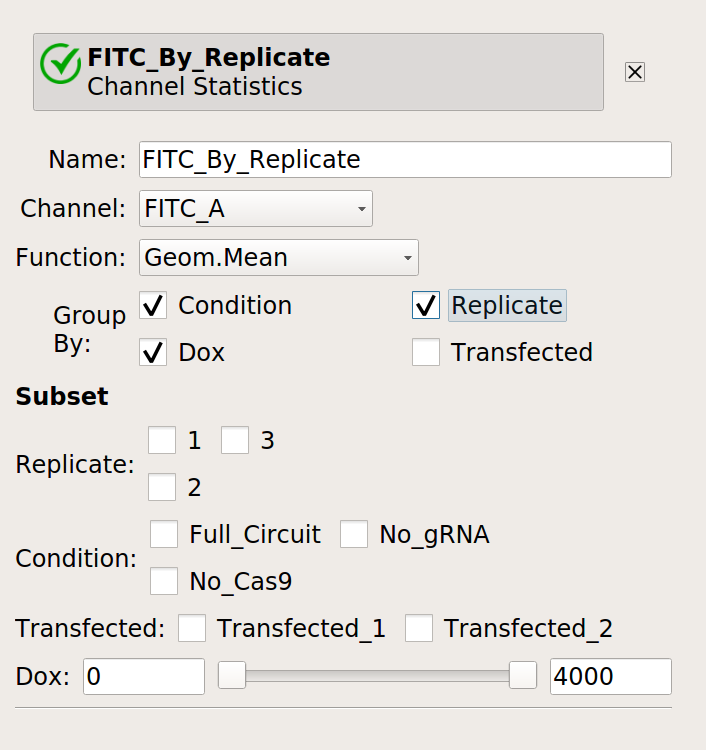
Next, make a statistic with the geometric mean broken out by condition, Dox and replicate.
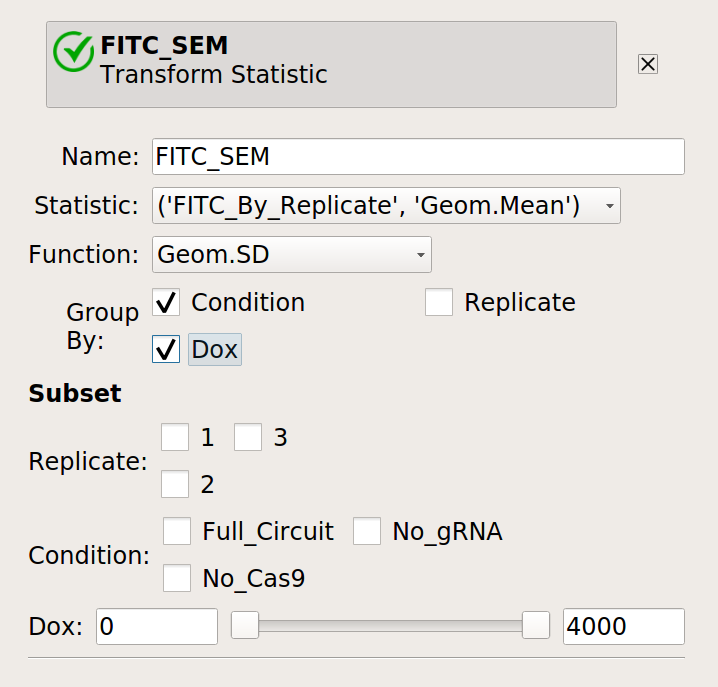
Finally, compute the geometric standard deviation of the mean:
Then plot them together:
Further exploration
So that’s useful, but maybe there’s more in this data. We’ve noticed in our lab that gene circuit behavior frequently changes as copy number changes. Is this the case here? We can bin the data by transfection level, and see if the behavior changes as the bin number increases.
Add a binning operation:
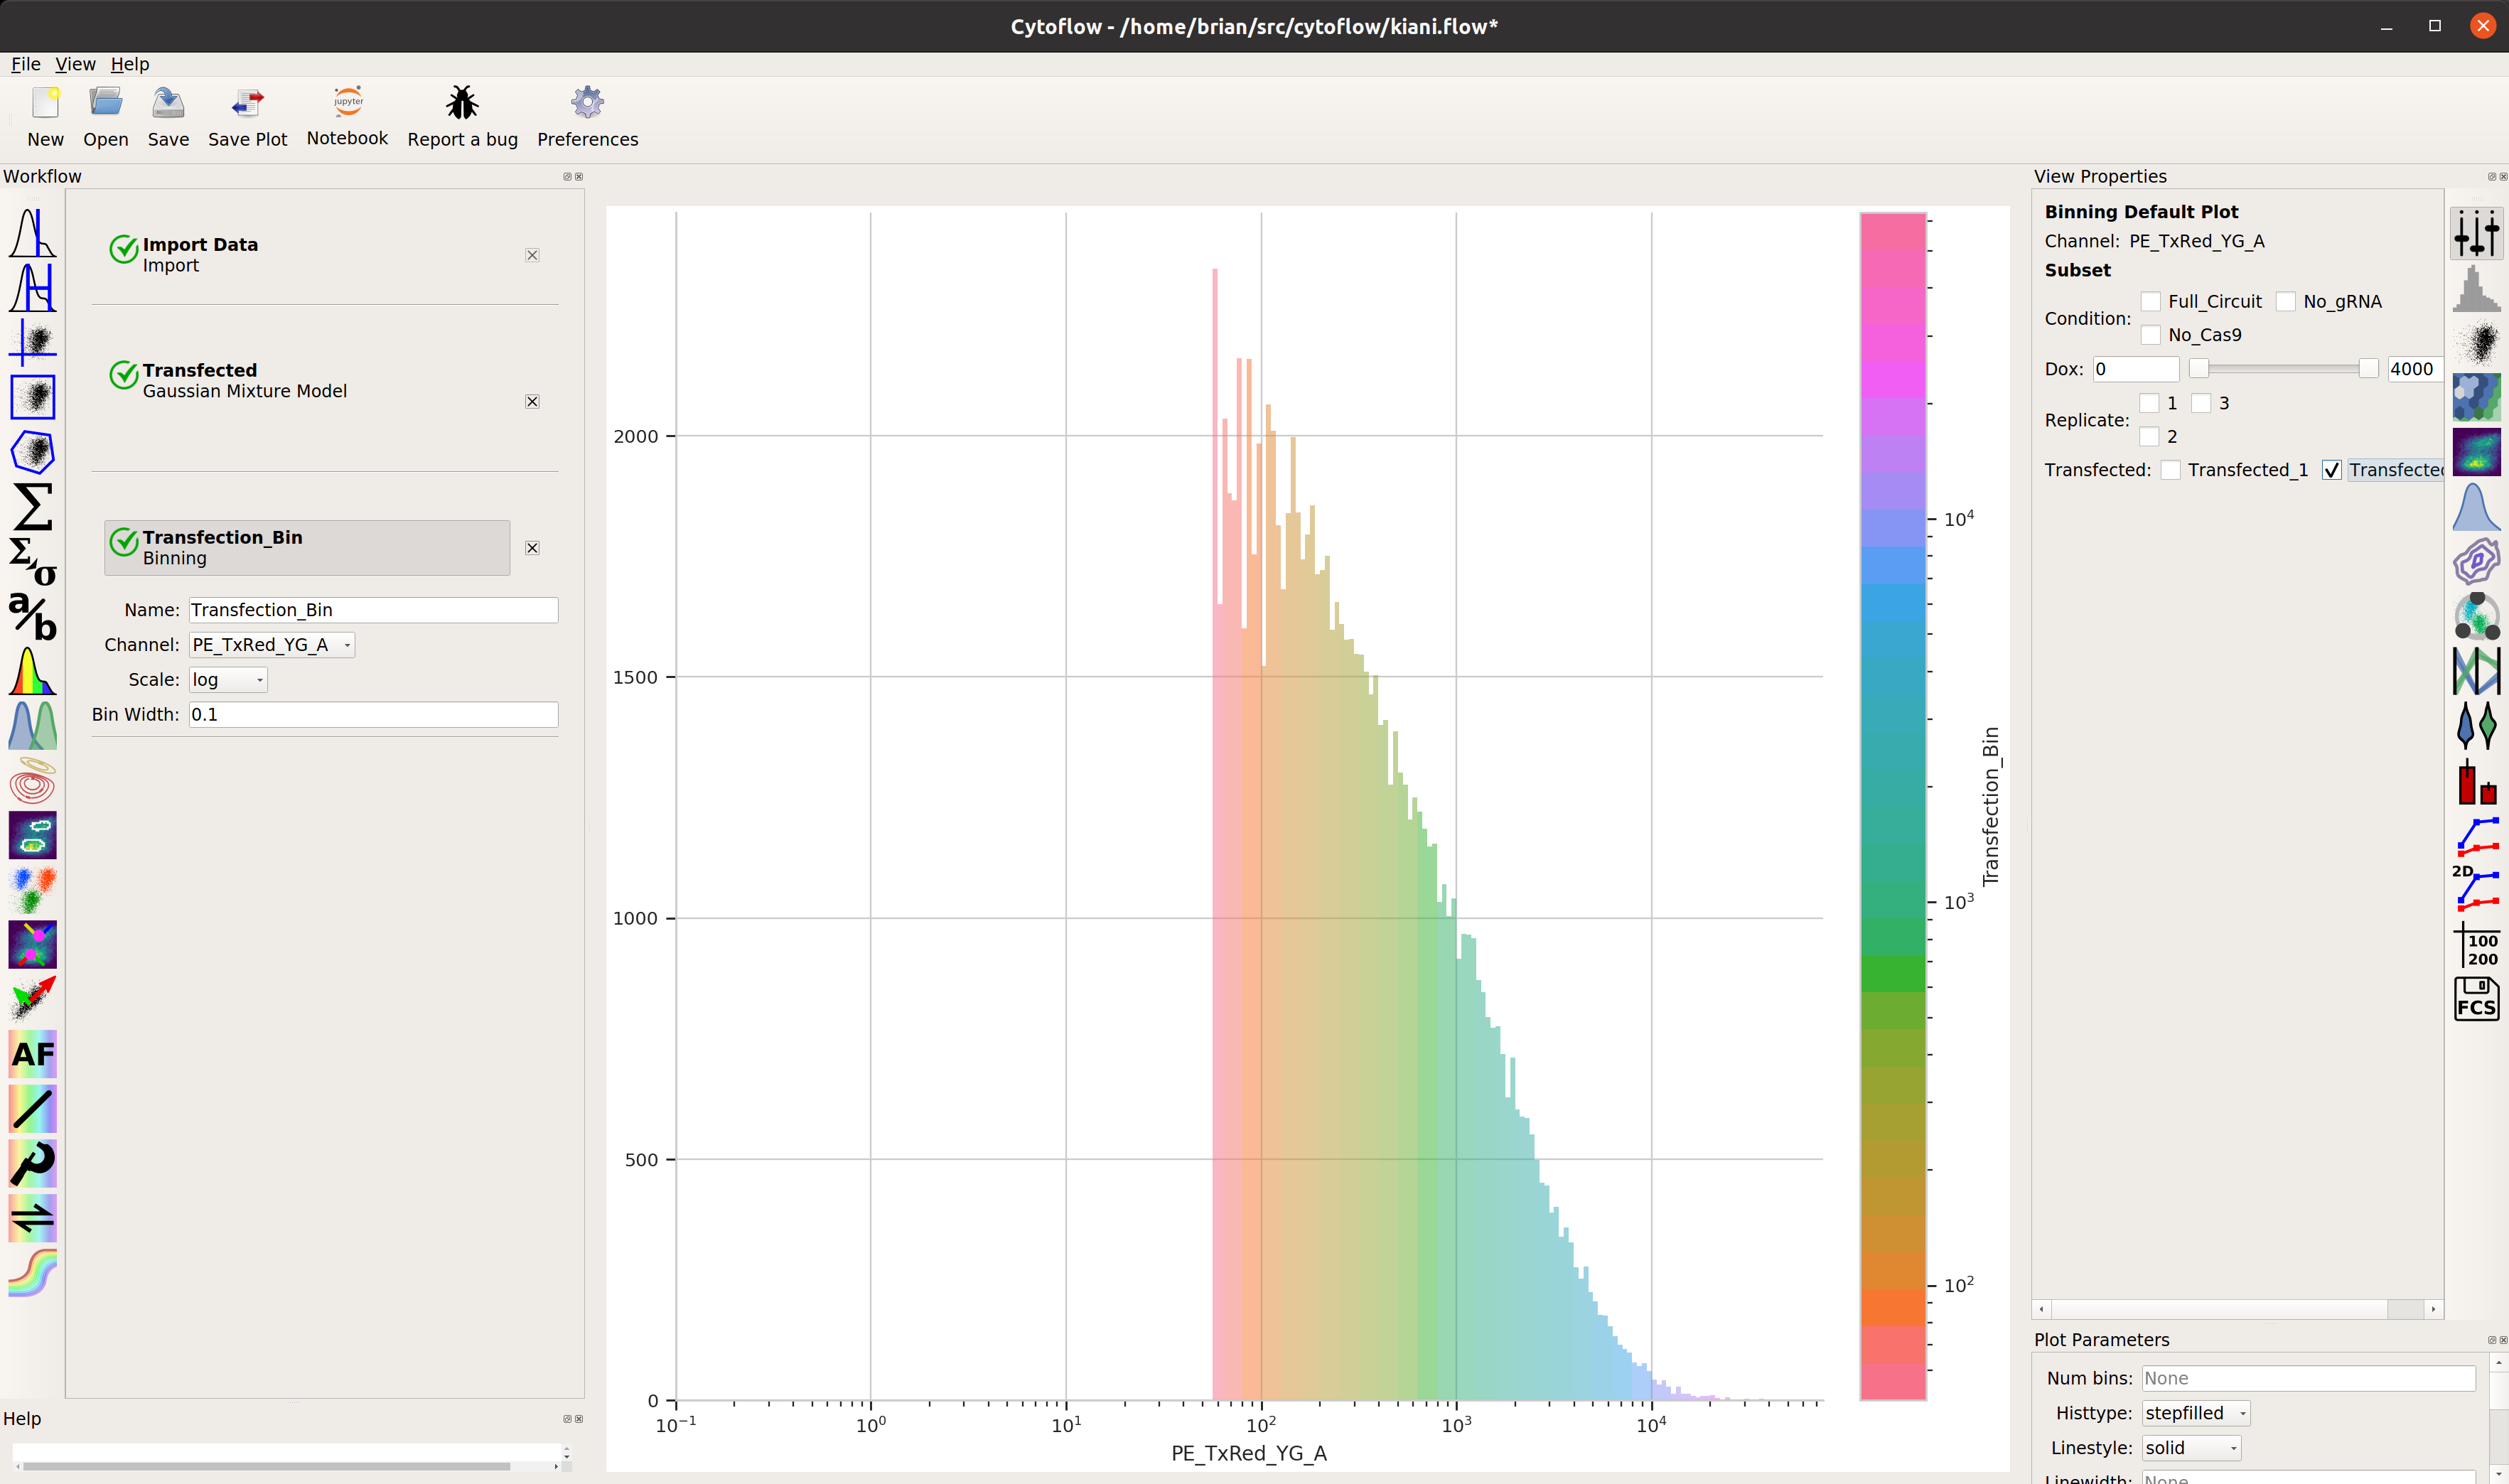
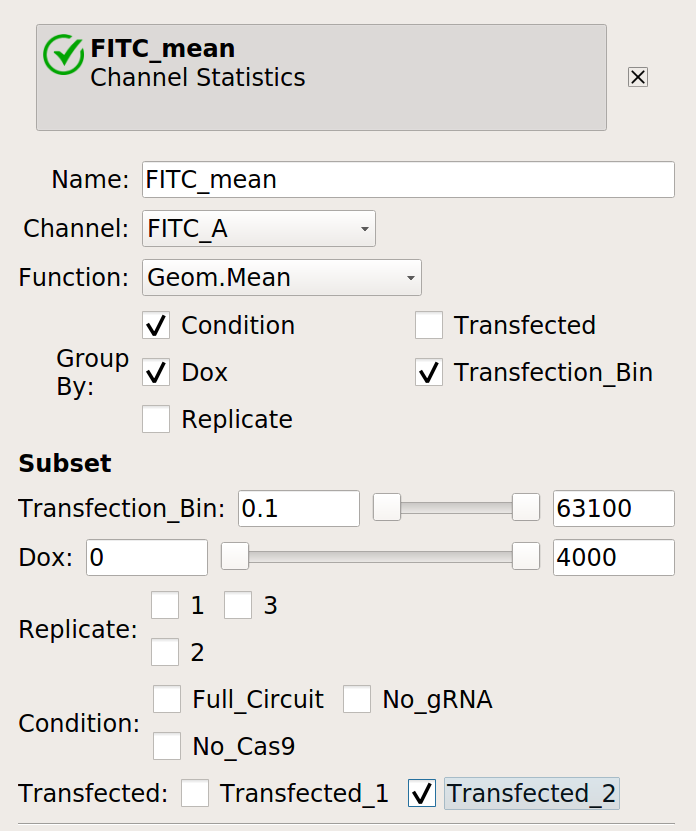
Make a statistic that computes the mean FITC signal in each bin:
Does it change as the bin number increases?
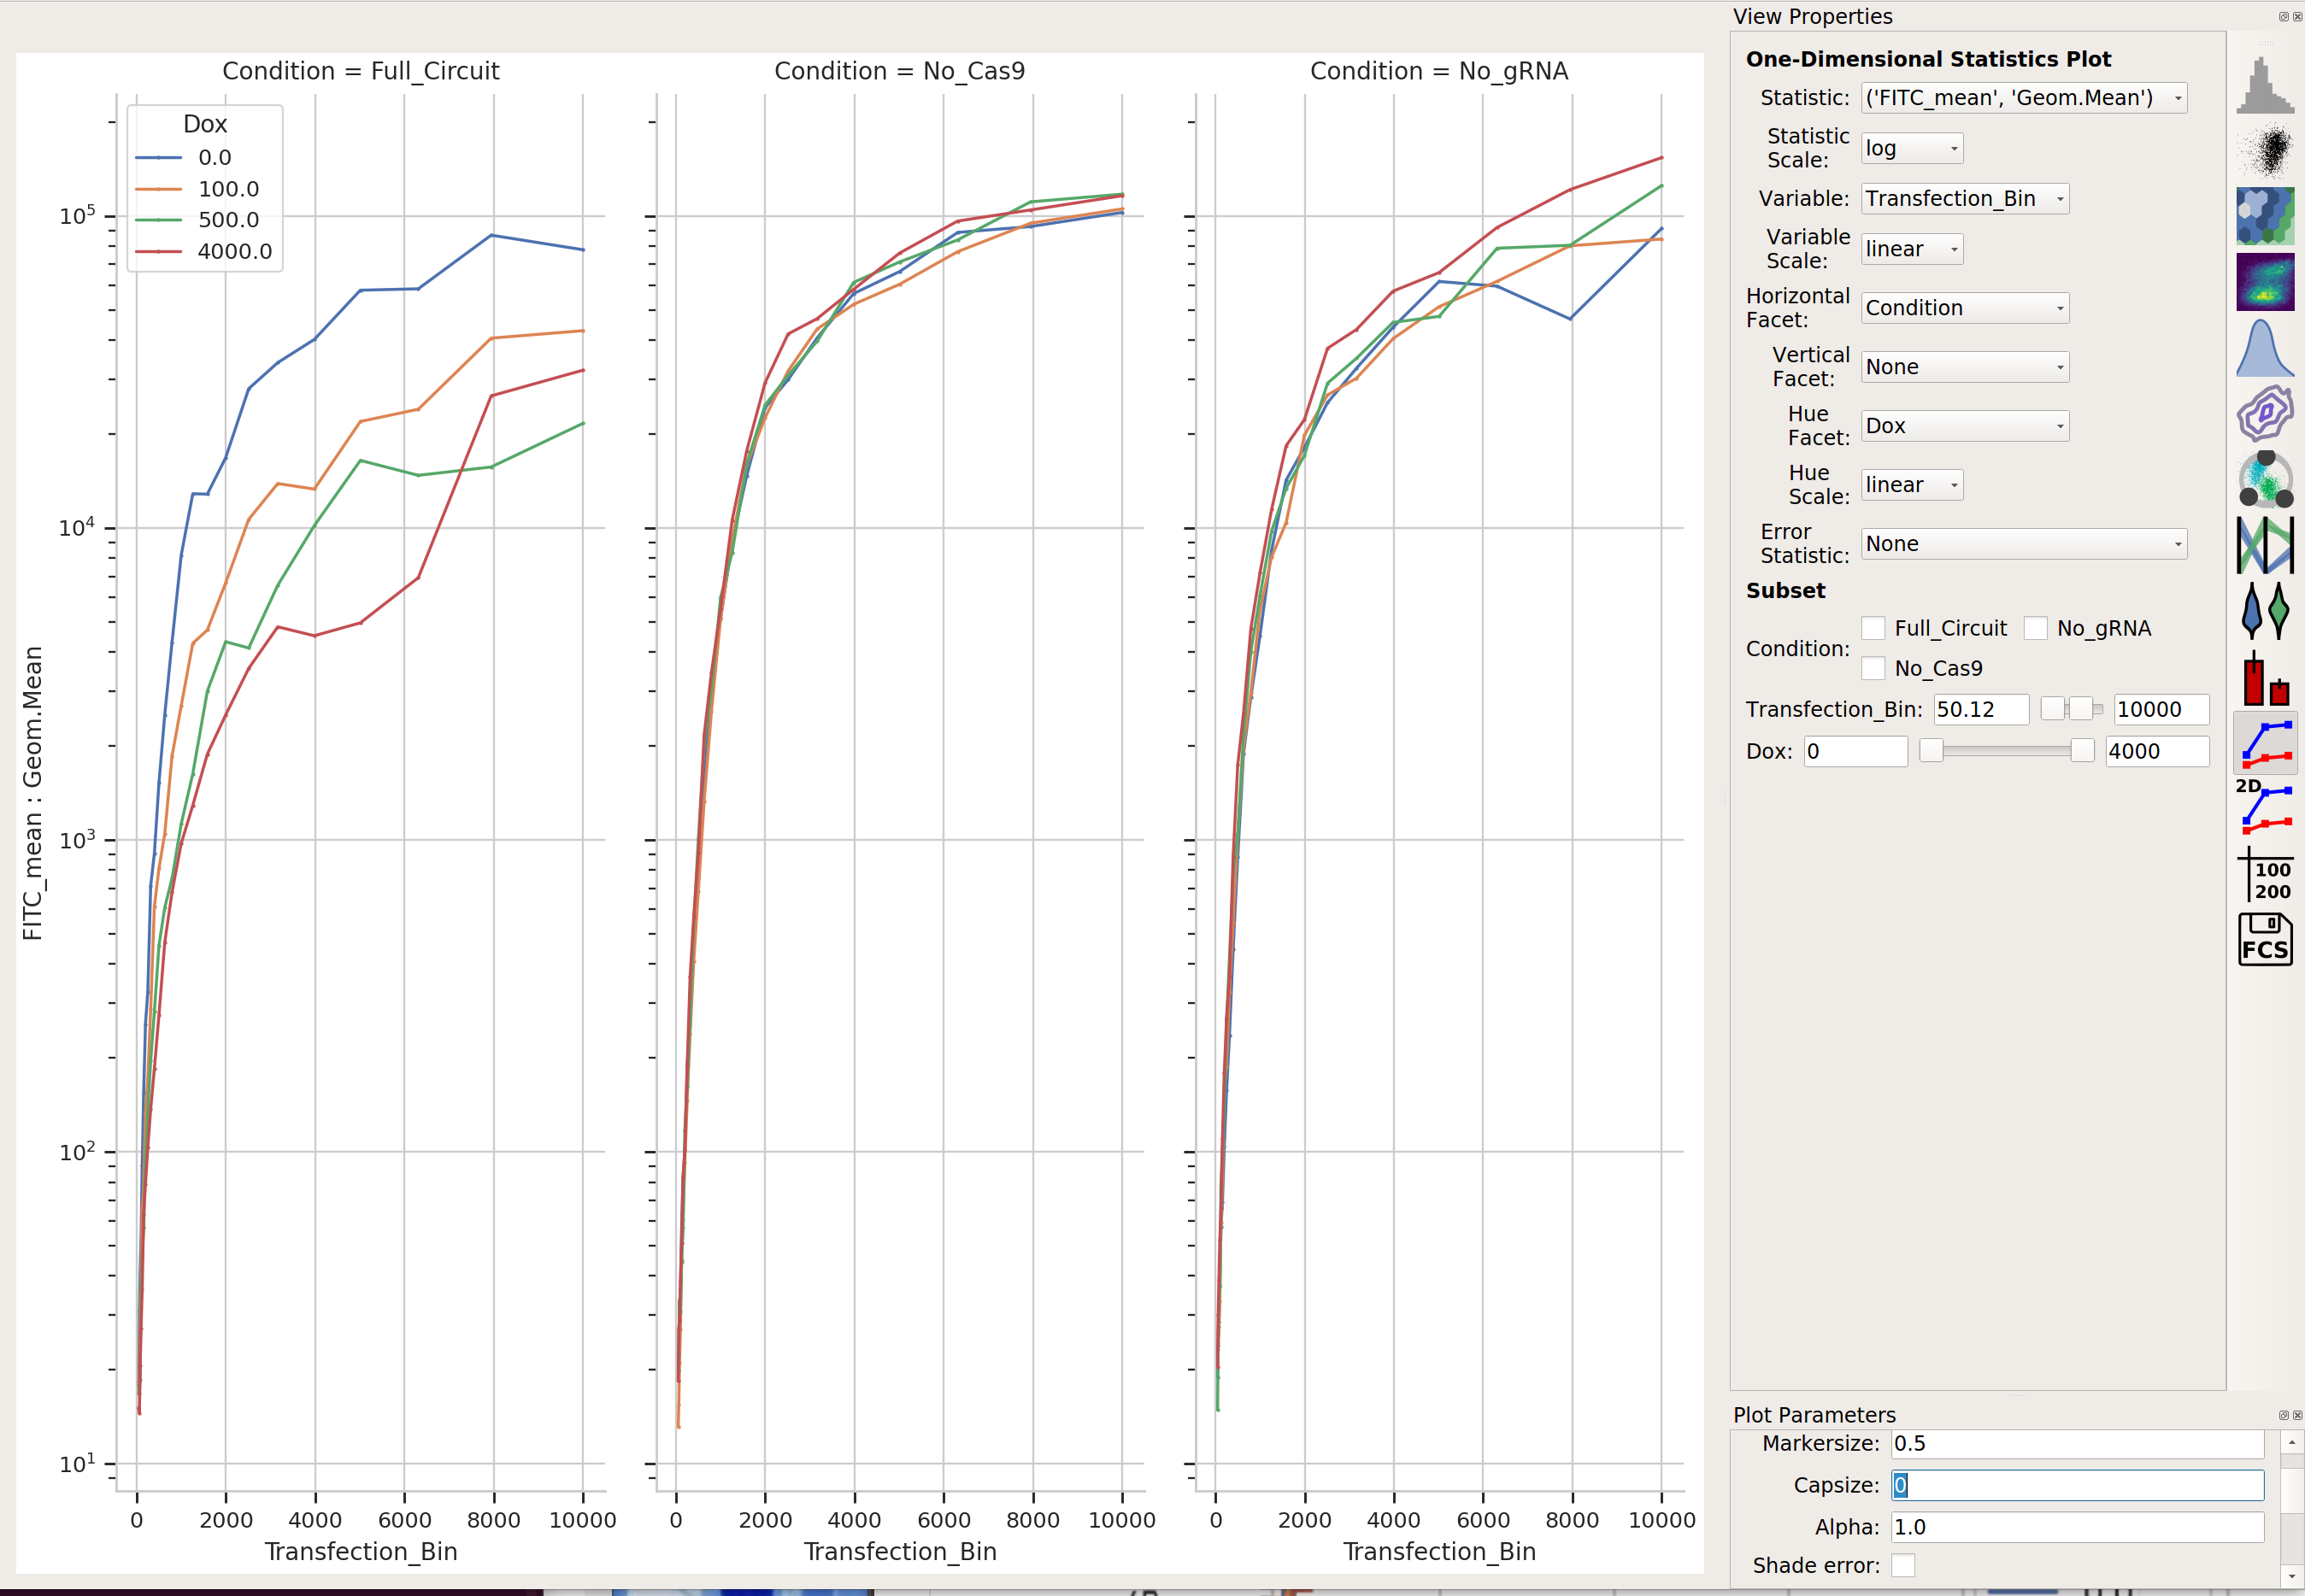
I would say it does!