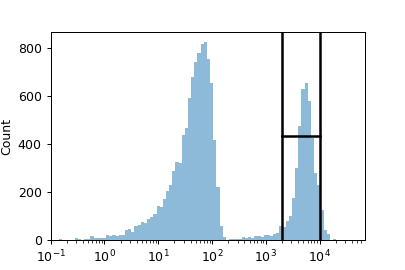
Range Gate
Draw a range gate. To draw a new range, click-and-drag across the plot.
- Name
The operation name. Used to name the new metadata field that’s created by this module.
- Channel
The name of the channel to apply the gate to.
- Low
The low threshold of the gate.
- High
The high threshold of the gate.
- Scale
The scale of the axis for the interactive plot
- Hue facet
Show different experimental conditions in different colors.
- Subset
Show only a subset of the data.