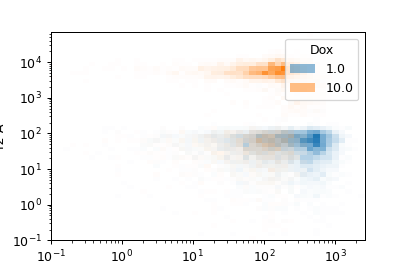
2D Histogram
Plots a 2-dimensional histogram. Similar to a density plot, but the number of events in a bin change the bin’s opacity, so you can use different colors.
- X Channel, Y Channel
The channels to plot on the X and Y axes.
- X Scale, Y Scale
How to scale the X and Y axes of the plot.
- Horizonal Facet
Make multiple plots. Each column has a unique value of this variable.
- Vertical Facet
Make multiple plots. Each row has a unique value of this variable.
- Color Facet
Plot with multiple colors. Each color has a unique value of this variable.
- Color Scale
If Color Facet is a numeric variable, use this scale for the color bar.
- Tab Facet
Make multiple plots in differen tabs; each tab’s plot has a unique value of this variable.
- Subset
Plot only a subset of the data in the experiment.