Frequently Asked Questions#
These are some questions that are commonly asked about Cytoflow’s modules, especially by new users.
Cytoflow seems like it could be useful for analyzing data other than FCS files. Can I do that?
Maybe! Quite a few portions of the package assume that the data is from a flow
cytometer. This is quite explicitly baked into the point-and-click GUI; less
so with the Python modules. If you want to give it a go (and are using the
Python modules), have a look at the Experiment class. You’ll have to
build one of those manually – instead of creating one with ImportOp
– and you’ll obviously need to avoid modules that explicitly expect other FCS
files to parameterize them. But otherwise, once you’ve got a fully-formed
Experiment, you should (probably) be fine to use (most of) the rest of the package(?)
Let me know how you get on.
How do I save the plots I’ve made with the Python modules?
cytoflow uses the matplotlib.pyplot stateful interface for making
plots. Thus, there are two ways to save the plots. The first is to use the
matplotlib.pyplot.savefig() – see the matplotlib documentation
for more details. (This option gives you the greatest flexibility in format,
resolution, etc.)
If you are using the Jupyter notebook, the second is to replace the
%matplotlib inline magic with %matplotlib notebook. Then,
when you make a plot, the plot remains interactive. Here’s an
example:
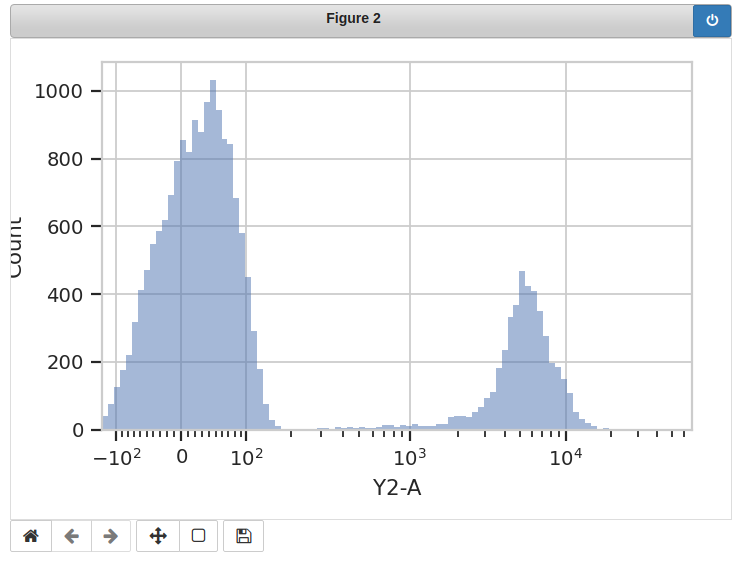
Click the “disk” icon to download a copy of the image.