cytoflowgui.view_plugins.density#
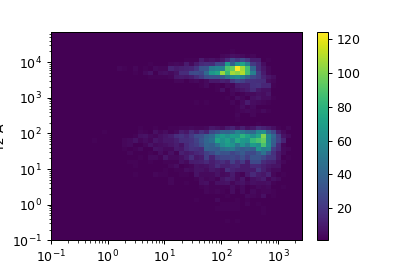
Plots a 2-dimensional density plot.
- X Channel, Y Channel
The channels to plot on the X and Y axes.
- X Scale, Y Scale
How to scale the X and Y axes of the plot.
- Horizonal Facet
Make multiple plots. Each column has a unique value of this variable.
- Vertical Facet
Make multiple plots. Each row has a unique value of this variable.
- Color Scale
Scale the color palette and the color bar
- Tab Facet
Make multiple plots in differen tabs; each tab’s plot has a unique value of this variable.
- Subset
Plot only a subset of the data in the experiment.
- class cytoflowgui.view_plugins.density.DensityParamsHandler(*args: Any, **kwargs: Any)[source]#
Bases:
Controller
- class cytoflowgui.view_plugins.density.DensityHandler(*args: Any, **kwargs: Any)[source]#
Bases:
ViewHandler