cytoflowgui.view_plugins.bar_chart#
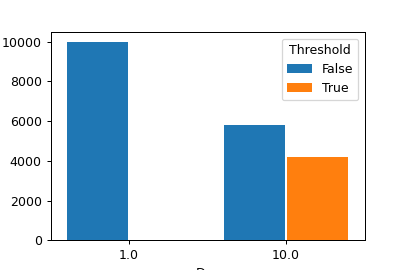
Plots a bar chart of a statistic.
Each variable in the statistic (ie, each variable chosen in the statistic operation’s Group By) must be set as Variable or as a facet.
- Statistic
Which statistic to plot. This is usually the name of the operation that added the statistic.
- Feature
Which column in the statistic should be plotted?
- Variable
The statistic variable to use as the major bar groups.
- Scale
How to scale the statistic plot.
- Horizontal Facet
Make muliple plots, with each column representing a subset of the statistic with a different value for this variable.
- Vertical Facet
Make multiple plots, with each row representing a subset of the statistic with a different value for this variable.
- Hue Facet
Make multiple bars with different colors; each color represents a subset of the statistic with a different value for this variable.
- Error Statistic
A statistic to use to make the error bars. Must have the same variables as the statistic in Statistic.
- Subset
Plot only a subset of the statistic.
- class cytoflowgui.view_plugins.bar_chart.BarChartParamsHandler(*args: Any, **kwargs: Any)[source]#
Bases:
Controller