cytoflowgui.op_plugins.range2d#
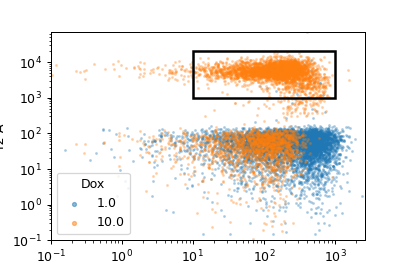
Draw a 2-dimensional range gate (eg, a rectangle). To set the gate, click-and-drag on the plot.
- Name
The operation name. Used to name the new metadata field that’s created by this operation.
- X channel
The name of the channel on the X axis.
- X Low
The low threshold in the X channel.
- X High
The high threshold in the X channel.
- Y channel
The name of the channel on the Y axis.
- Y Low
The low threshold in the Y channel.
- Y High
The high threshold in the Y channel.
- X Scale
The scale of the X axis for the interactive plot.
- Y Scale
The scale of the Y axis for the interactive plot
- Hue facet
Show different experimental conditions in different colors.
- Subset
Show only a subset of the data.
- class cytoflowgui.op_plugins.range2d.Range2DViewParamsHandler(*args: Any, **kwargs: Any)[source]#
Bases:
Controller
- class cytoflowgui.op_plugins.range2d.Range2DHandler(*args: Any, **kwargs: Any)[source]#
Bases:
OpHandler
- class cytoflowgui.op_plugins.range2d.Range2DViewHandler(*args: Any, **kwargs: Any)[source]#
Bases:
ViewHandler