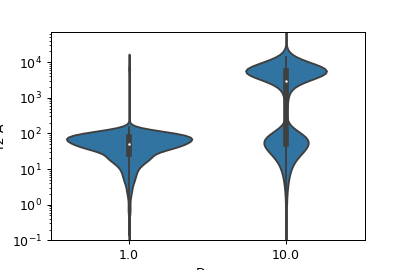
Violin Plot#
Plots a violin plot, which is a nice way to compare several distributions.
- X Variable
The variable to compare on the X axis.
- Y Channel
The channel to plot on the Y axis.
- Y Channel Scale
How to scale the Y axis of the plot.
- Horizonal Facet
Make multiple plots. Each column has a unique value of this variable.
- Vertical Facet
Make multiple plots. Each row has a unique value of this variable.
- Color Facet
Plot with multiple colors. Each color has a unique value of this variable.
- Color Scale
If Color Facet is a numeric variable, use this scale for the color bar.
- Tab Facet
Make multiple plots in differen tabs; each tab’s plot has a unique value of this variable.
- Subset
Plot only a subset of the data in the experiment.