Guide: Which measure of center should I use?#
When analyzing flow cytometry data, we often want to know the center of a distribution. For example, we may be treating our cells with a drug and want to be able to report that “fluorescence decreased XXX fold.”
Often, we use the arithmetic mean to find the center. For example, in the histogram below, I’ve drawn 100,000 samples from a normal distribution with a mean of 1000 and a standard deviation of 100. The arithmetic mean is 999.40; I’ve drawn a red line on the plot at this position.
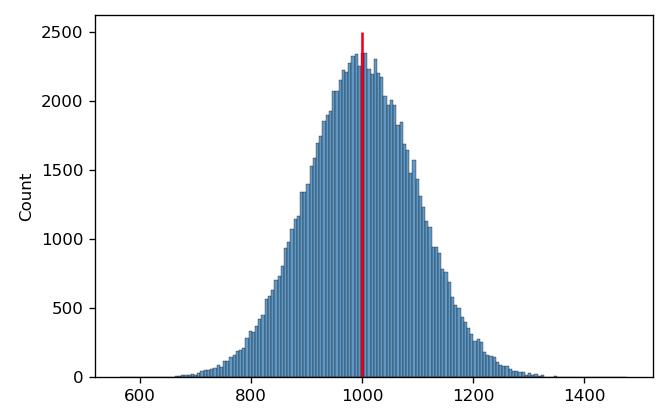
It’s pretty clear that this is a good measure of this distribution’s center. However, in cytometry, we often encounter distributions that are symmetrical on a log scale. This is the case below – and again, I’ve drawn a red line at the arithmetic mean of this distribution.
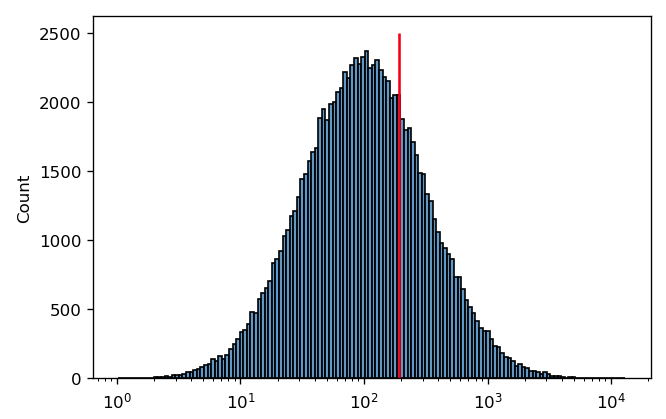
In this case, it’s pretty clear that the arithmetic mean is not a good measure of this distribution’s “center”. It’s easy to see why this is happening if we plot the same data on a linear scale instead:
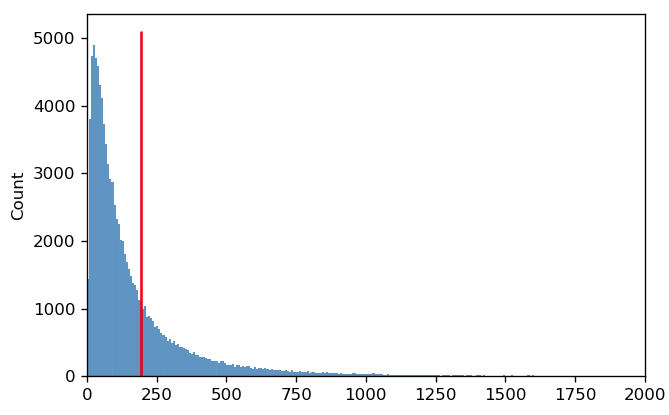
The reason that the arithmetic mean isn’t a good measure of center is because on a linear scale, the distribution is not symmetric. Instead, the mean is being “dragged” up by the larger values in the “tail” of the distribution.
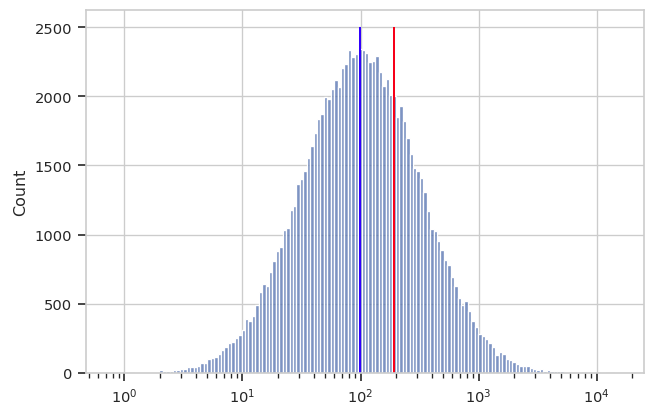
A better measure of center for this kind of distribution is the geometric mean. Let’s say we have n values. Instead of adding the values together and dividing by n (arithmetic mean), to find the geometric mean we multiply all the numbers together and then take the nth root. Below, you can see the log-scaled data again, with the arithmetic mean in red and the geometric mean in blue. It’s clear that for data of this sort, the geometric mean is a better measure of “center”.
Cytoflow implements both a geometric mean (to measure center)
and a geometric “standard deviation” to measure spread. I highly
recommend you use these instead of their arithmetic brethren when analyzing
data that appears normal (or at least symmetric) on a logarithmic
scale.
PS - why is so much biology log-normal? My colleague Jacob Beal has done some theoretical work on the topic. You can read his paper here:
Biochemical complexity drives log-normal variation in genetic expression. Jacob Beal, Engineering Biology, 1.1 (2017), pp. 55-60, July 2017. https://digital-library.theiet.org/content/journals/10.1049/enb.2017.0004