Guide: How can I understand the experiment structure?#
When creating a complex analysis, it can be easy to lose track of the channels, conditions, and statistics that you’ve created in your workflow. In order to give users both a quick overview of their experiment and allow them to “drill down” into their experiment structure, Cytoflow includes an Experiment Browser.
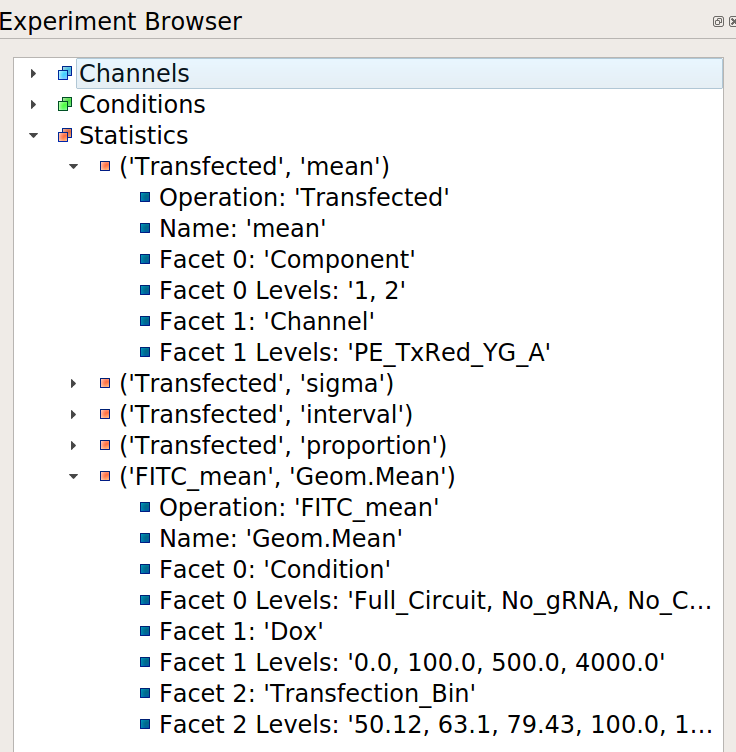
Consider the experiment outlined in Tutorial: Synthetic Gene Logic Network – five channels, three experimental conditions, two conditions added in the analysis, and a number of statistics. It’s a lot to keep in your head! However, if you select the last operation in the workflow, the Experiment Browser shows this:
Note
If the Experiment Browser isn’t visible, you can show it by selecting it from the View menu or clicking the corresponding button on the button bar.
Here, you can see the channels, conditions, and statistics in the experiment in a tree view. If you open one, by clicking the caret or double-clicking the name, you are shown additional information about each. Let’s walk through all three below.
Channels#
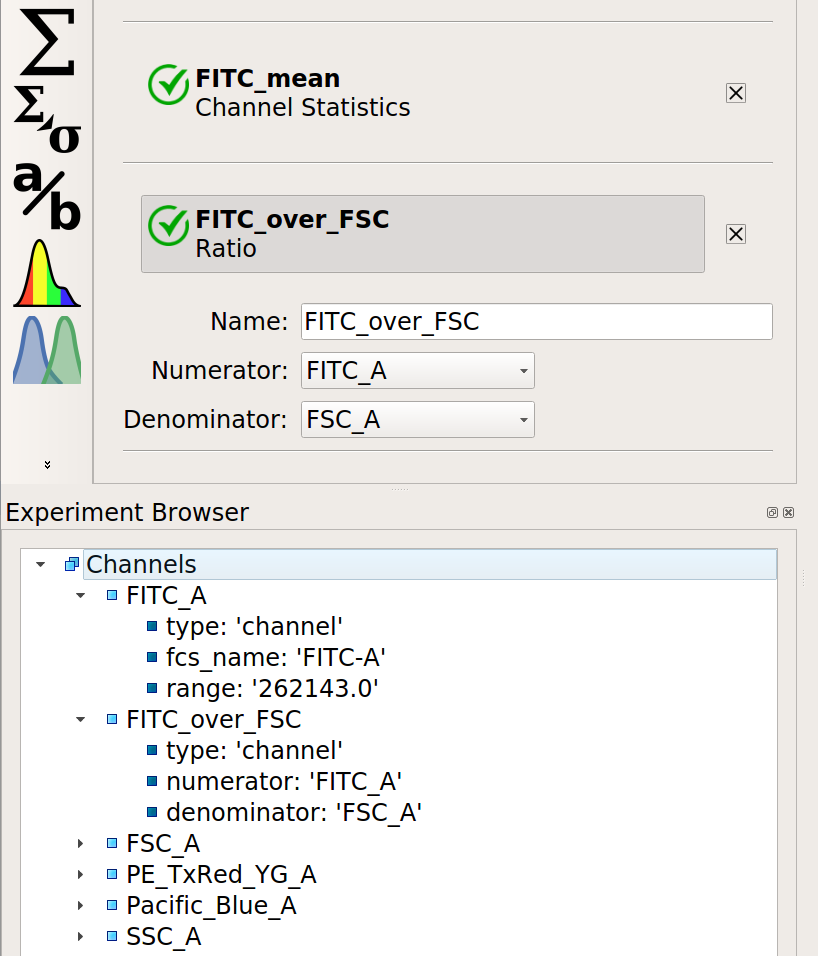
Each channel is shown in the experiment browser. When you open a channel,
additional metadata about the channel is visible, such as the original name
in the .fcs file and the range of the channel. Additionally, if the channel
has been manipulated in any way, or is a “synthetic” or derived channel, the
operations that did so leave some metadata as well. For example, if you
create a new channel with the Ratio operation, the numerator and
demoninator are show.
Conditions#
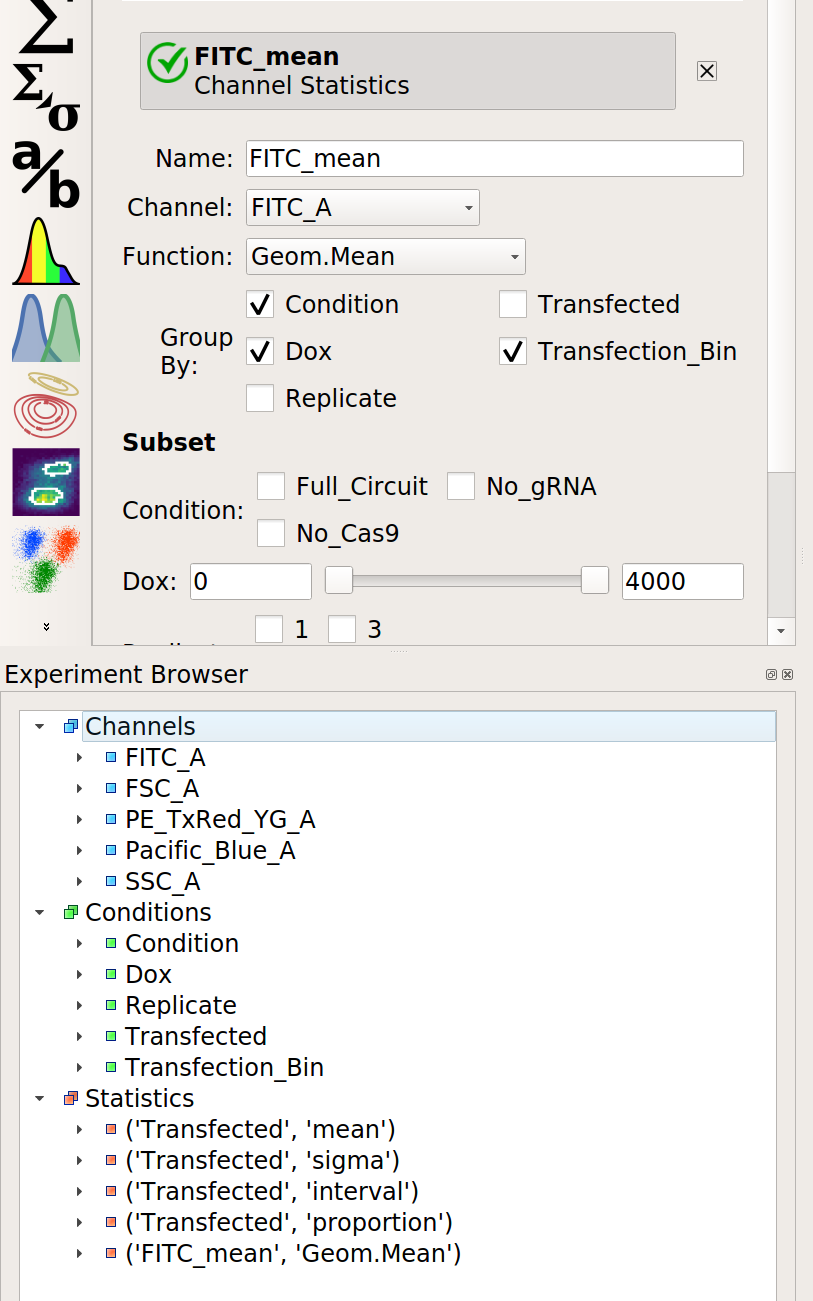
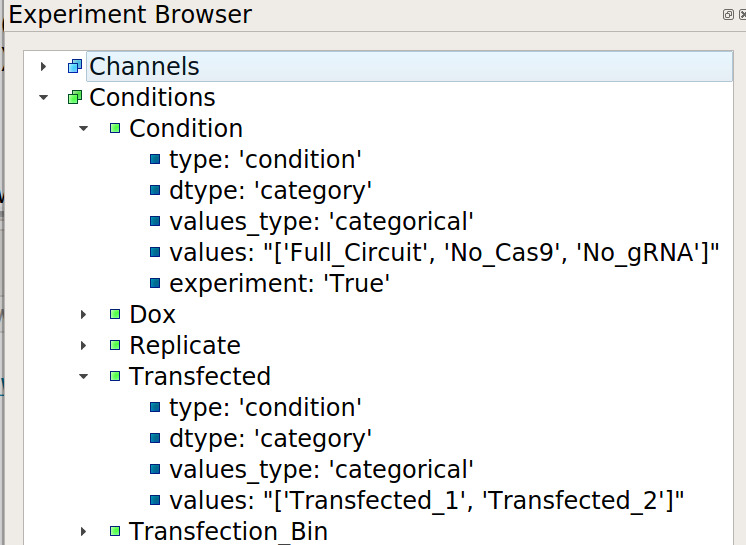
Remember, conditions – either experimental conditions or conditions that were added by operations – are how you control the plotting and statistics. You can view the conditions in the browser as well. When you open them, you can see the type of condition, the condition’s type (boolean, numeric, categorical), and the values of that condition.
Statistics#
Remember, statistics are summaries of the data that are computed by an operation. The statistics that have been added to the experiment are also shown by the browser window, including the facets over which the statistic was computed and the various values of those facets.