cytoflowgui.op_plugins.quad
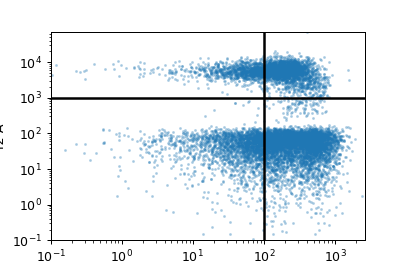
Draw a “quadrant” gate. To create a new gate, just click where you’d like the
intersection to be. Creates a new metadata column named name, with values
name_1 (upper-left quadrant), name_2 (upper-right),
name_3 (lower-left), and name_4 (lower-right).
Note
This matches the order of FACSDiva quad gates.
- Name
The operation name. Used to name the new metadata field that’s created by this operation.
- X channel
The name of the channel on the X axis.
- X threshold
The threshold in the X channel.
- Y channel
The name of the channel on the Y axis.
- Y threshold
The threshold in the Y channel.
- X Scale
The scale of the X axis for the interactive plot.
- Y Scale
The scale of the Y axis for the interactive plot
- Hue facet
Show different experimental conditions in different colors.
- Subset
Show only a subset of the data.
- class cytoflowgui.op_plugins.quad.QuadHandler(*args: Any, **kwargs: Any)[source]
Bases:
traitsui.api.
- class cytoflowgui.op_plugins.quad.QuadViewHandler(*args: Any, **kwargs: Any)[source]
Bases:
traitsui.api.
- class cytoflowgui.op_plugins.quad.QuadPlugin[source]
Bases:
envisage.plugin.Plugin,cytoflowgui.op_plugins.op_plugin_base.PluginHelpMixin- operation_id = 'edu.mit.synbio.cytoflow.operations.quad'
- view_id = 'edu.mit.synbio.cytoflow.views.quad'
- short_name = 'Quad'