cytoflowgui.op_plugins.polygon
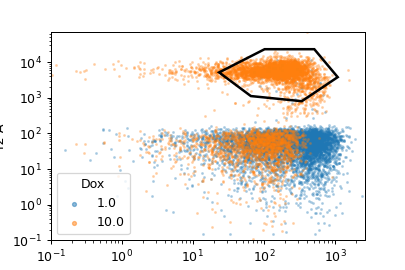
Draw a polygon gate. To add vertices, use a single-click; to close the polygon, click the first vertex a second time.
- Name
The operation name. Used to name the new metadata field that’s created by this module.
- X Channel
The name of the channel on the gate’s X axis.
- Y Channel
The name of the channel on the gate’s Y axis.
- X Scale
The scale of the X axis for the interactive plot.
- Y Scale
The scale of the Y axis for the interactive plot
- Hue facet
Show different experimental conditions in different colors.
- Subset
Show only a subset of the data.
- class cytoflowgui.op_plugins.polygon.PolygonHandler(*args: Any, **kwargs: Any)[source]
Bases:
traitsui.api.
- class cytoflowgui.op_plugins.polygon.PolygonViewHandler(*args: Any, **kwargs: Any)[source]
Bases:
traitsui.api.
- class cytoflowgui.op_plugins.polygon.PolygonPlugin[source]
Bases:
envisage.plugin.Plugin,cytoflowgui.op_plugins.op_plugin_base.PluginHelpMixin- operation_id = 'edu.mit.synbio.cytoflow.operations.polygon'
- view_id = 'edu.mit.synbio.cytoflow.views.polygon'
- short_name = 'Polygon Gate'