cytoflow.operations.bleedthrough_linear
The bleedthrough_linear module contains two classes:
BleedthroughLinearOp – compensates for spectral bleedthrough
in a Experiment using single-color controls
BleedthroughLinearDiagnostic – a diagnostic view to make sure
that BleedthroughLinearOp correctly estimated its parameters.
- class cytoflow.operations.bleedthrough_linear.BleedthroughLinearOp[source]
Bases:
traits.has_traits.HasStrictTraitsApply matrix-based bleedthrough correction to a set of fluorescence channels.
This is a traditional matrix-based compensation for bleedthrough. For each pair of channels, the user specifies the proportion of the first channel that bleeds through into the second; then, the module performs a matrix multiplication to compensate the raw data.
The module can also estimate the bleedthrough matrix using one single-color control per channel.
This works best on data that has had autofluorescence removed first; if that is the case, then the autofluorescence will be subtracted from the single-color controls too.
To use, set up the
controlsdict with the single color controls; callestimateto parameterize the operation; check that the bleedthrough plots look good by callingBleedthroughLinearDiagnostic.ploton theBleedthroughLinearDiagnosticinstance returned bydefault_view; and thenapplyon anExperiment.- controls
The channel names to correct, and corresponding single-color control FCS files to estimate the correction splines with. Must be set to use
estimate.- Type
Dict(Str, File)
- spillover
The spillover “matrix” to use to correct the data. The keys are pairs of channels, and the values are proportions of spectral overlap. If
("channel1", "channel2")is present as a key,("channel2", "channel1")must also be present. The module does not assume that the matrix is symmetric.- Type
Dict(Tuple(Str, Str), Float)
- control_conditions
Occasionally, you’ll need to specify the experimental conditions that the bleedthrough tubes were collected under (to apply the operations in the history.) Specify them here. The key is the channel name; they value is a dictionary of the conditions (same as you would specify for a
cytoflow.operations.import_op.Tube)- Type
Dict(Str, Dict(Str, Any))
Examples
Create a small experiment:
>>> import cytoflow as flow
>>> import_op = flow.ImportOp()
>>> import_op.tubes = [flow.Tube(file = "tasbe/rby.fcs")]
>>> ex = import_op.apply()
Correct for autofluorescence
>>> af_op = flow.AutofluorescenceOp()
>>> af_op.channels = ["Pacific Blue-A", "FITC-A", "PE-Tx-Red-YG-A"]
>>> af_op.blank_file = "tasbe/blank.fcs"
>>> af_op.estimate(ex)
>>> af_op.default_view().plot(ex)
>>> ex2 = af_op.apply(ex)
Create and parameterize the operation
>>> bl_op = flow.BleedthroughLinearOp()
>>> bl_op.controls = {'Pacific Blue-A' : 'tasbe/ebfp.fcs',
...                   'FITC-A' : 'tasbe/eyfp.fcs',
...                   'PE-Tx-Red-YG-A' : 'tasbe/mkate.fcs'}
Estimate the model parameters
>>> bl_op.estimate(ex2)
Plot the diagnostic plot
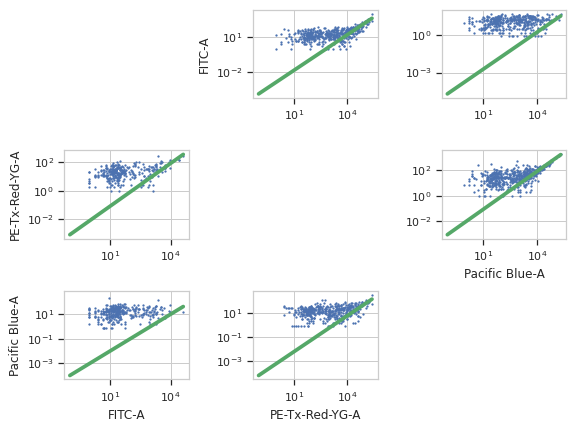
Note
The diagnostic plots look really bad in the online documentation. They’re better in a real-world example, I promise!
>>> bl_op.default_view().plot(ex2)
Apply the operation to the experiment
>>> ex2 = bl_op.apply(ex2)
- estimate(experiment, subset=None)[source]
Estimate the bleedthrough from simgle-channel controls in
controls
- apply(experiment)[source]
Applies the bleedthrough correction to an experiment.
- Parameters
experiment (
Experiment) – The experiment to which this operation is applied- Returns
A new
Experimentwith the bleedthrough subtracted out. The corrected channels have the following metadata added:linear_bleedthrough : Dict(Str : Float) The values for spillover from other channels into this channel.
bleedthrough_channels : List(Str) The channels that were used to correct this one.
bleedthrough_fn : Callable (Tuple(Float) –> Float) The function that will correct one event in this channel. Pass it the values specified in
controlsand it will return the corrected value for this channel.
- Return type
- default_view(**kwargs)[source]
Returns a diagnostic plot to make sure spillover estimation is working.
- Returns
An
IView, callBleedthroughLinearDiagnostic.plotto see the diagnostic plots- Return type
- class cytoflow.operations.bleedthrough_linear.BleedthroughLinearDiagnostic[source]
Bases:
traits.has_traits.HasStrictTraitsPlots a scatterplot of each channel vs every other channel and the bleedthrough line
- op
The operation whose parameters we’re viewing. If you made the instance with
BleedthroughLinearOp.default_view, this is set for you already.- Type
Instance(BleedthroughPiecewiseOp)