cytoflow.operations.flowpeaks
The flowpeaks module has the classes that support the flowPeaks
clustering algorithm. It has four classes:
FlowPeaksOp – an operation that implements the flowPeaks
algorithm (see the class documentation for a reference.)
FlowPeaks1DView – a diagnostic view that shows how the
FlowPeaksOp performed its clustering (on a 1D data set,
using a histogram).
FlowPeaks2DView – a diagnostic view that shows how the
FlowPeaksOp performed its clustering (on a 2D data set,
using a scatter plot).
FlowPeaks2DDensityView – a diagnostic view that shows how the
FlowPeaksOp performed its clustering (on a 2D data set,
using a density plot).
- class cytoflow.operations.flowpeaks.FlowPeaksOp[source]
Bases:
traits.has_traits.HasStrictTraitsThis module uses the flowPeaks algorithm to assign events to clusters in an unsupervised manner.
Call
estimateto compute the clusters.Calling
applycreates a new categorical metadata variable namedname, with possible values{name}_1….name_nwherenis the number of clusters estimated.The same model may not be appropriate for different subsets of the data set. If this is the case, you can use the
byattribute to specify metadata by which to aggregate the data before estimating (and applying) a model. The number of clusters is a model parameter and it may vary in each subset.- name
The operation name; determines the name of the new metadata column
- Type
Str
- channels
The channels to apply the clustering algorithm to.
- Type
List(Str)
- scale
Re-scale the data in the specified channels before fitting. If a channel is in
channelsbut not inscale, the current package-wide default (set withset_default_scale) is used.- Type
Dict(Str : Enum(“linear”, “logicle”, “log”))
- by
A list of metadata attributes to aggregate the data before estimating the model. For example, if the experiment has two pieces of metadata,
TimeandDox, settingby = ["Time", "Dox"]will fit the model separately to each subset of the data with a unique combination ofTimeandDox.- Type
List(Str)
- h
A scalar value by which to scale the covariance matrices of the underlying density function. (See
Notes, below, for more details.)- Type
Float (default = 1.5)
- h0
A scalar value by which to smooth the covariance matrices of the underlying density function. (See
Notes, below, for more details.)- Type
Float (default = 1.0)
- tol
How readily should clusters be merged? Must be between 0 and 1. See
Notes, below, for more details.- Type
Float (default = 0.5)
- merge_dist
How far apart can clusters be before they are merged? This is a unit-free scalar, and is approximately the maximum number of k-means clusters between peaks.
- Type
Float (default = 5)
- find_outliers
Should the algorithm use an extra step to identify outliers?
Note
I have disabled this code until I can try to make it faster.
- Type
Bool (default = False)
Notes
This algorithm uses kmeans to find a large number of clusters, then hierarchically merges those clusters. Thus, the user does not need to specify the number of clusters in advance, and it can find non-convex clusters. It also operates in an arbitrary number of dimensions.
The merging happens in two steps. First, the cluster centroids are used to estimate an underlying density function. Then, the local maxima of the density function are found using a numerical optimization starting from each centroid, and k-means clusters that converge to the same local maximum are merged. Finally, these clusters-of-clusters are merged if their local maxima are (a) close enough, and (b) the density function between them is smooth enough. Thus, the final assignment of each event depends on the k-means cluster it ends up in, and which cluster-of-clusters that k-means centroid is assigned to.
There are a lot of parameters that affect this process. The k-means clustering is pretty robust (though somewhat sensitive to the number of clusters, which is currently not exposed in the API.) The most important are exposed as attributes of the
FlowPeaksOpclass. These include:tol: How smooth does the density function have to be between twodensity maxima to merge them? Must be between 0 and 1.
merge_dist: How close must two maxima be to merge them? Thisvalue is a unit-free scalar, and is approximately the number of k-means clusters between the two maxima.
For details and a theoretical justification, see 1
References
- 1
Ge, Yongchao and Sealfon, Stuart C. “flowPeaks: a fast unsupervised clustering for flow cytometry data via K-means and density peak finding” Bioinformatics (2012) 28 (15): 2052-2058.
Examples
Make a little data set.
>>> import cytoflow as flow
>>> import_op = flow.ImportOp()
>>> import_op.tubes = [flow.Tube(file = "Plate01/RFP_Well_A3.fcs",
...                              conditions = {'Dox' : 10.0}),
...                    flow.Tube(file = "Plate01/CFP_Well_A4.fcs",
...                              conditions = {'Dox' : 1.0})]
>>> import_op.conditions = {'Dox' : 'float'}
>>> ex = import_op.apply()
Create and parameterize the operation.
>>> fp_op = flow.FlowPeaksOp(name = 'Flow',
...                          channels = ['V2-A', 'Y2-A'],
...                          scale = {'V2-A' : 'log',
...                                   'Y2-A' : 'log'},
...                          h0 = 3)
Estimate the clusters
>>> fp_op.estimate(ex)
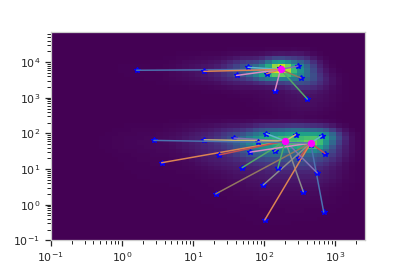
Plot a diagnostic view of the underlying density
>>> fp_op.default_view(density = True).plot(ex)
Apply the gate
>>> ex2 = fp_op.apply(ex)
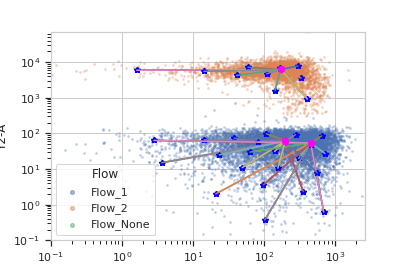
Plot a diagnostic view with the event assignments
>>> fp_op.default_view().plot(ex2)
- estimate(experiment, subset=None)[source]
Estimate the k-means clusters, then hierarchically merge them.
- Parameters
experiment (
Experiment) – TheExperimentto use to estimate the k-means clusterssubset (str (default = None)) – A Python expression that specifies a subset of the data in
experimentto use to parameterize the operation.
- apply(experiment)[source]
Assign events to a cluster.
Assigns each event to one of the k-means centroids from
estimate, then groups together events in the same cluster hierarchy.- Parameters
experiment (
Experiment) – theExperimentto apply the gate to.- Returns
A new
Experimentwith the gate applied to it. TODO - document the extra statistics- Return type
- default_view(**kwargs)[source]
Returns a diagnostic plot of the Gaussian mixture model.
- Parameters
channels (List(Str)) – Which channels to plot? Must be contain either one or two channels.
scale (List({‘linear’, ‘log’, ‘logicle’})) – How to scale the channels before plotting them
density (bool) – Should we plot a scatterplot or the estimated density function?
- Returns
- Return type
- class cytoflow.operations.flowpeaks.FlowPeaks1DView[source]
Bases:
cytoflow.operations.base_op_views.By1DView,cytoflow.operations.base_op_views.AnnotatingView,cytoflow.views.histogram.HistogramViewA one-dimensional diagnostic view for
FlowPeaksOp. Plots a histogram of the channel, then overlays the k-means centroids in blue.- facets
A read-only list of the conditions used to facet this view.
- Type
List(Str)
- by
A read-only list of the conditions used to group this view’s data before plotting.
- Type
List(Str)
- channel
The channel this view is viewing. If you created the view using
default_view, this is already set.- Type
Str
- scale
The way to scale the x axes. If you created the view using
default_view, this may be already set.- Type
{‘linear’, ‘log’, ‘logicle’}
- op
The
IOperationthat this view is associated with. If you created the view usingdefault_view, this is already set.- Type
Instance(
IOperation)
- subset
An expression that specifies the subset of the statistic to plot. Passed unmodified to
pandas.DataFrame.query.- Type
- xfacet
Set to one of the
Experiment.conditionsin theExperiment, and a new column of subplots will be added for every unique value of that condition.- Type
String
- yfacet
Set to one of the
Experiment.conditionsin theExperiment, and a new row of subplots will be added for every unique value of that condition.- Type
String
- huefacet
Set to one of the
Experiment.conditionsin the in theExperiment, and a new color will be added to the plot for every unique value of that condition.- Type
String
- plot(experiment, **kwargs)[source]
Plot the plots.
- Parameters
experiment (Experiment) – The
Experimentto plot using this view.title (str) – Set the plot title
xlabel (str) – Set the X axis label
ylabel (str) – Set the Y axis label
huelabel (str) – Set the label for the hue facet (in the legend)
legend (bool) – Plot a legend for the color or hue facet? Defaults to
True.sharex (bool) – If there are multiple subplots, should they share X axes? Defaults to
True.sharey (bool) – If there are multiple subplots, should they share Y axes? Defaults to
True.row_order (list) – Override the row facet value order with the given list. If a value is not given in the ordering, it is not plotted. Defaults to a “natural ordering” of all the values.
col_order (list) – Override the column facet value order with the given list. If a value is not given in the ordering, it is not plotted. Defaults to a “natural ordering” of all the values.
hue_order (list) – Override the hue facet value order with the given list. If a value is not given in the ordering, it is not plotted. Defaults to a “natural ordering” of all the values.
height (float) – The height of each row in inches. Default = 3.0
aspect (float) – The aspect ratio of each subplot. Default = 1.5
col_wrap (int) – If
xfacetis set andyfacetis not set, you can “wrap” the subplots around so that they form a multi-row grid by setting this to the number of columns you want.sns_style ({“darkgrid”, “whitegrid”, “dark”, “white”, “ticks”}) – Which
seabornstyle to apply to the plot? Default iswhitegrid.sns_context ({“paper”, “notebook”, “talk”, “poster”}) – Which
seaborncontext to use? Controls the scaling of plot elements such as tick labels and the legend. Default istalk.palette (palette name, list, or dict) – Colors to use for the different levels of the hue variable. Should be something that can be interpreted by
seaborn.color_palette, or a dictionary mapping hue levels to matplotlib colors.despine (Bool) – Remove the top and right axes from the plot? Default is
True.min_quantile (float (>0.0 and <1.0, default = 0.001)) – Clip data that is less than this quantile.
max_quantile (float (>0.0 and <1.0, default = 1.00)) – Clip data that is greater than this quantile.
lim ((float, float)) – Set the range of the plot’s data axis.
orientation ({‘vertical’, ‘horizontal’})
num_bins (int) – The number of bins to plot in the histogram. Clipped to [100, 1000]
histtype ({‘stepfilled’, ‘step’, ‘bar’}) – The type of histogram to draw.
stepfilledis the default, which is a line plot with a color filled under the curve.density (bool) – If
True, re-scale the histogram to form a probability density function, so the area under the histogram is 1.linewidth (float) – The width of the histogram line (in points)
linestyle ([‘-’ | ‘–’ | ‘-.’ | ‘:’ | “None”]) – The style of the line to plot
alpha (float (default = 0.5)) – The alpha blending value, between 0 (transparent) and 1 (opaque).
color (matplotlib color) – The color to plot the annotations. Overrides the default color cycle.
plot_name (Str) – If this
IViewcan make multiple plots,plot_nameis the name of the plot to make. Must be one of the values retrieved fromenum_plots.
- class cytoflow.operations.flowpeaks.FlowPeaks2DView[source]
Bases:
cytoflow.operations.base_op_views.By2DView,cytoflow.operations.base_op_views.AnnotatingView,cytoflow.views.scatterplot.ScatterplotViewA two-dimensional diagnostic view for
FlowPeaksOp. Plots a scatter-plot of the two channels, then overlays the k-means centroids in blue and the clusters-of-k-means in pink.- facets
A read-only list of the conditions used to facet this view.
- Type
List(Str)
- by
A read-only list of the conditions used to group this view’s data before plotting.
- Type
List(Str)
- xchannel
The channels to use for this view’s X axis. If you created the view using
default_view, this is already set.- Type
Str
- ychannel
The channels to use for this view’s Y axis. If you created the view using
default_view, this is already set.- Type
Str
- xscale
The way to scale the x axis. If you created the view using
default_view, this may be already set.- Type
{‘linear’, ‘log’, ‘logicle’}
- yscale
The way to scale the y axis. If you created the view using
default_view, this may be already set.- Type
{‘linear’, ‘log’, ‘logicle’}
- op
The
IOperationthat this view is associated with. If you created the view usingdefault_view, this is already set.- Type
Instance(
IOperation)
- subset
An expression that specifies the subset of the statistic to plot. Passed unmodified to
pandas.DataFrame.query.- Type
- xfacet
Set to one of the
Experiment.conditionsin theExperiment, and a new column of subplots will be added for every unique value of that condition.- Type
String
- yfacet
Set to one of the
Experiment.conditionsin theExperiment, and a new row of subplots will be added for every unique value of that condition.- Type
String
- huefacet
Set to one of the
Experiment.conditionsin the in theExperiment, and a new color will be added to the plot for every unique value of that condition.- Type
String
- plot(experiment, **kwargs)[source]
Plot the plots.
- Parameters
experiment (Experiment) – The
Experimentto plot using this view.title (str) – Set the plot title
xlabel (str) – Set the X axis label
ylabel (str) – Set the Y axis label
huelabel (str) – Set the label for the hue facet (in the legend)
legend (bool) – Plot a legend for the color or hue facet? Defaults to
True.sharex (bool) – If there are multiple subplots, should they share X axes? Defaults to
True.sharey (bool) – If there are multiple subplots, should they share Y axes? Defaults to
True.row_order (list) – Override the row facet value order with the given list. If a value is not given in the ordering, it is not plotted. Defaults to a “natural ordering” of all the values.
col_order (list) – Override the column facet value order with the given list. If a value is not given in the ordering, it is not plotted. Defaults to a “natural ordering” of all the values.
hue_order (list) – Override the hue facet value order with the given list. If a value is not given in the ordering, it is not plotted. Defaults to a “natural ordering” of all the values.
height (float) – The height of each row in inches. Default = 3.0
aspect (float) – The aspect ratio of each subplot. Default = 1.5
col_wrap (int) – If
xfacetis set andyfacetis not set, you can “wrap” the subplots around so that they form a multi-row grid by setting this to the number of columns you want.sns_style ({“darkgrid”, “whitegrid”, “dark”, “white”, “ticks”}) – Which
seabornstyle to apply to the plot? Default iswhitegrid.sns_context ({“paper”, “notebook”, “talk”, “poster”}) – Which
seaborncontext to use? Controls the scaling of plot elements such as tick labels and the legend. Default istalk.palette (palette name, list, or dict) – Colors to use for the different levels of the hue variable. Should be something that can be interpreted by
seaborn.color_palette, or a dictionary mapping hue levels to matplotlib colors.despine (Bool) – Remove the top and right axes from the plot? Default is
True.min_quantile (float (>0.0 and <1.0, default = 0.001)) – Clip data that is less than this quantile.
max_quantile (float (>0.0 and <1.0, default = 1.00)) – Clip data that is greater than this quantile.
xlim ((float, float)) – Set the range of the plot’s X axis.
ylim ((float, float)) – Set the range of the plot’s Y axis.
alpha (float (default = 0.25)) – The alpha blending value, between 0 (transparent) and 1 (opaque).
s (int (default = 2)) – The size in points^2.
marker (a matplotlib marker style, usually a string) – Specfies the glyph to draw for each point on the scatterplot. See matplotlib.markers for examples. Default: ‘o’
color (matplotlib color) – The color to plot the annotations. Overrides the default color cycle.
plot_name (Str) – If this
IViewcan make multiple plots,plot_nameis the name of the plot to make. Must be one of the values retrieved fromenum_plots.
- class cytoflow.operations.flowpeaks.FlowPeaks2DDensityView[source]
Bases:
cytoflow.operations.base_op_views.By2DView,cytoflow.operations.base_op_views.AnnotatingView,cytoflow.operations.base_op_views.NullViewA two-dimensional diagnostic view for
FlowPeaksOp. Plots the estimated density function of the two channels, then overlays the k-means centroids in blue and the clusters-of-k-means in pink.- facets
A read-only list of the conditions used to facet this view.
- Type
List(Str)
- by
A read-only list of the conditions used to group this view’s data before plotting.
- Type
List(Str)
- xchannel
The channels to use for this view’s X axis. If you created the view using
default_view, this is already set.- Type
Str
- ychannel
The channels to use for this view’s Y axis. If you created the view using
default_view, this is already set.- Type
Str
- xscale
The way to scale the x axis. If you created the view using
default_view, this may be already set.- Type
{‘linear’, ‘log’, ‘logicle’}
- yscale
The way to scale the y axis. If you created the view using
default_view, this may be already set.- Type
{‘linear’, ‘log’, ‘logicle’}
- op
The
IOperationthat this view is associated with. If you created the view usingdefault_view, this is already set.- Type
Instance(
IOperation)
- subset
An expression that specifies the subset of the statistic to plot. Passed unmodified to
pandas.DataFrame.query.- Type
- xfacet
Set to one of the
Experiment.conditionsin theExperiment, and a new column of subplots will be added for every unique value of that condition.- Type
String
- yfacet
Set to one of the
Experiment.conditionsin theExperiment, and a new row of subplots will be added for every unique value of that condition.- Type
String
- huefacet
Set to one of the
Experiment.conditionsin the in theExperiment, and a new color will be added to the plot for every unique value of that condition.- Type
String
- plot(experiment, **kwargs)[source]
Plot the plots.
- Parameters
experiment (Experiment) – The
Experimentto plot using this view.title (str) – Set the plot title
xlabel (str) – Set the X axis label
ylabel (str) – Set the Y axis label
huelabel (str) – Set the label for the hue facet (in the legend)
legend (bool) – Plot a legend for the color or hue facet? Defaults to
True.sharex (bool) – If there are multiple subplots, should they share X axes? Defaults to
True.sharey (bool) – If there are multiple subplots, should they share Y axes? Defaults to
True.row_order (list) – Override the row facet value order with the given list. If a value is not given in the ordering, it is not plotted. Defaults to a “natural ordering” of all the values.
col_order (list) – Override the column facet value order with the given list. If a value is not given in the ordering, it is not plotted. Defaults to a “natural ordering” of all the values.
hue_order (list) – Override the hue facet value order with the given list. If a value is not given in the ordering, it is not plotted. Defaults to a “natural ordering” of all the values.
height (float) – The height of each row in inches. Default = 3.0
aspect (float) – The aspect ratio of each subplot. Default = 1.5
col_wrap (int) – If
xfacetis set andyfacetis not set, you can “wrap” the subplots around so that they form a multi-row grid by setting this to the number of columns you want.sns_style ({“darkgrid”, “whitegrid”, “dark”, “white”, “ticks”}) – Which
seabornstyle to apply to the plot? Default iswhitegrid.sns_context ({“paper”, “notebook”, “talk”, “poster”}) – Which
seaborncontext to use? Controls the scaling of plot elements such as tick labels and the legend. Default istalk.palette (palette name, list, or dict) – Colors to use for the different levels of the hue variable. Should be something that can be interpreted by
seaborn.color_palette, or a dictionary mapping hue levels to matplotlib colors.despine (Bool) – Remove the top and right axes from the plot? Default is
True.min_quantile (float (>0.0 and <1.0, default = 0.001)) – Clip data that is less than this quantile.
max_quantile (float (>0.0 and <1.0, default = 1.00)) – Clip data that is greater than this quantile.
color (matplotlib color) – The color to plot the annotations. Overrides the default color cycle.
xlim ((float, float)) – Set the range of the plot’s X axis.
ylim ((float, float)) – Set the range of the plot’s Y axis.
plot_name (Str) – If this
IViewcan make multiple plots,plot_nameis the name of the plot to make. Must be one of the values retrieved fromenum_plots.