cytoflowgui.view_plugins.scatterplot
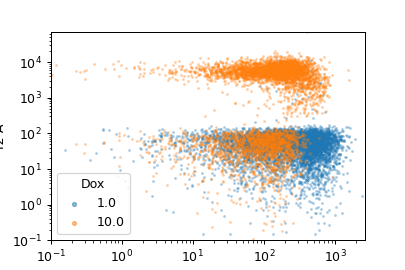
Plot a scatterplot.
- X Channel, Y Channel
The channels to plot on the X and Y axes.
- X Scale, Y Scale
How to scale the X and Y axes of the plot.
- Horizonal Facet
Make multiple plots. Each column has a unique value of this variable.
- Vertical Facet
Make multiple plots. Each row has a unique value of this variable.
- Color Facet
Plot with multiple colors. Each color has a unique value of this variable.
- Color Scale
If Color Facet is a numeric variable, use this scale for the color bar.
- Tab Facet
Make multiple plots in differen tabs; each tab’s plot has a unique value of this variable.
- Subset
Plot only a subset of the data in the experiment.
- class cytoflowgui.view_plugins.scatterplot.ScatterplotParamsHandler(*args: Any, **kwargs: Any)[source]
Bases:
traitsui.api.Controller
- class cytoflowgui.view_plugins.scatterplot.ScatterplotHandler(*args: Any, **kwargs: Any)[source]
Bases:
cytoflowgui.view_plugins.view_plugin_base.ViewHandler
- class cytoflowgui.view_plugins.scatterplot.ScatterplotPlugin[source]
Bases:
envisage.plugin.Plugin,cytoflowgui.view_plugins.view_plugin_base.PluginHelpMixin- view_id = 'edu.mit.synbio.cytoflow.view.scatterplot'
- short_name = 'Scatter Plot'