cytoflowgui.view_plugins.parallel_coords
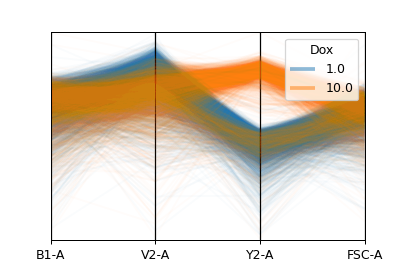
Plots a parallel coordinates plot. PC plots are good for multivariate data; each vertical line represents one attribute, and one set of connected line segments represents one data point.
- Channels
The channels to plot, and their scales. Drag the blue dot to re-order.
- Add Channel, Remove Channel
Add or remove a channel
- Horizonal Facet
Make multiple plots. Each column has a unique value of this variable.
- Vertical Facet
Make multiple plots. Each row has a unique value of this variable.
- Color Facet
Plot different values of a condition with different colors.
- Color Scale
Scale the color palette and the color bar
- Tab Facet
Make multiple plots in differen tabs; each tab’s plot has a unique value of this variable.
- Subset
Plot only a subset of the data in the experiment.
- class cytoflowgui.view_plugins.parallel_coords.ParallelCoordinatesParamsHandler(*args: Any, **kwargs: Any)[source]
Bases:
traitsui.api.
- class cytoflowgui.view_plugins.parallel_coords.ChannelHandler(*args: Any, **kwargs: Any)[source]
Bases:
traitsui.api.
- class cytoflowgui.view_plugins.parallel_coords.ParallelCoordinatesHandler(*args: Any, **kwargs: Any)[source]
Bases:
traitsui.api.- add_channel
alias of
traits.trait_types.Event
- remove_channel
alias of
traits.trait_types.Event
- channels = <traits.traits.ForwardProperty object>
- class cytoflowgui.view_plugins.parallel_coords.ParallelCoordinatesPlugin[source]
Bases:
envisage.plugin.Plugin,cytoflowgui.view_plugins.view_plugin_base.PluginHelpMixin- view_id = 'edu.mit.synbio.cytoflow.view.parallel_coords'
- short_name = 'Parallel Coordinates Plot'