cytoflow.operations.bleedthrough_linear
-
class
cytoflow.operations.bleedthrough_linear.BleedthroughLinearOp[source]¶ Bases:
traits.has_traits.HasStrictTraitsApply matrix-based bleedthrough correction to a set of fluorescence channels.
This is a traditional matrix-based compensation for bleedthrough. For each pair of channels, the user specifies the proportion of the first channel that bleeds through into the second; then, the module performs a matrix multiplication to compensate the raw data.
The module can also estimate the bleedthrough matrix using one single-color control per channel.
This works best on data that has had autofluorescence removed first; if that is the case, then the autofluorescence will be subtracted from the single-color controls too.
To use, set up the
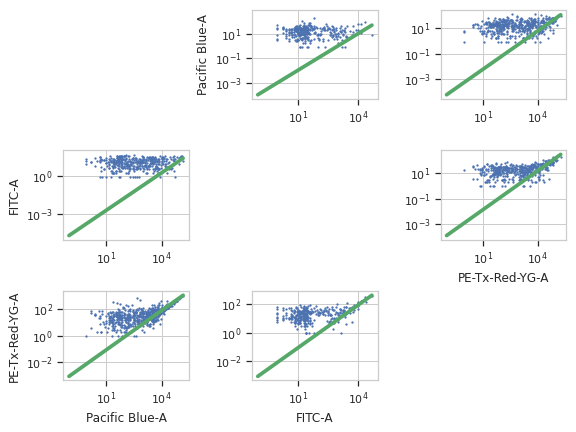
controlsdict with the single color controls; callestimate()to parameterize the operation; check that the bleedthrough plots look good by callingplot()on theBleedthroughLinearDiagnosticinstance returned bydefault_view(); and thenapply()on anExperiment.-
controls¶ The channel names to correct, and corresponding single-color control FCS files to estimate the correction splines with. Must be set to use
estimate().Type: Dict(Str, File)
-
spillover¶ The spillover “matrix” to use to correct the data. The keys are pairs of channels, and the values are proportions of spectral overlap. If
("channel1", "channel2")is present as a key,("channel2", "channel1")must also be present. The module does not assume that the matrix is symmetric.Type: Dict(Tuple(Str, Str), Float)
-
control_conditions¶ Occasionally, you’ll need to specify the experimental conditions that the bleedthrough tubes were collected under (to apply the operations in the history.) Specify them here. The key is the channel name; they value is a dictionary of the conditions (same as you would specify for a
Tube)Type: Dict(Str, Dict(Str, Any))
Examples
Create a small experiment:
>>> import cytoflow as flow
>>> import_op = flow.ImportOp()
>>> import_op.tubes = [flow.Tube(file = "tasbe/rby.fcs")]
>>> ex = import_op.apply()
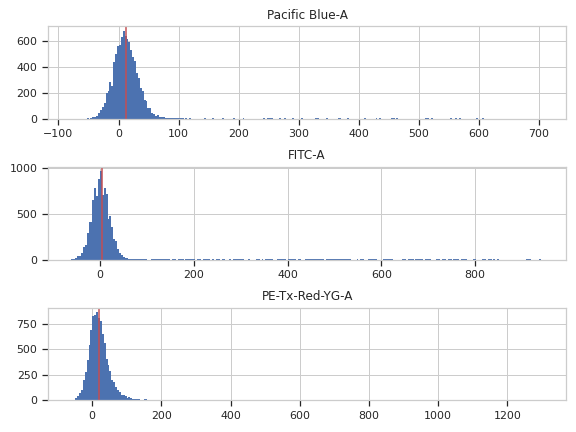
Correct for autofluorescence
>>> af_op = flow.AutofluorescenceOp()
>>> af_op.channels = ["Pacific Blue-A", "FITC-A", "PE-Tx-Red-YG-A"]
>>> af_op.blank_file = "tasbe/blank.fcs"
>>> af_op.estimate(ex)
>>> af_op.default_view().plot(ex)
>>> ex2 = af_op.apply(ex)

Create and parameterize the operation
>>> bl_op = flow.BleedthroughLinearOp()
>>> bl_op.controls = {'Pacific Blue-A' : 'tasbe/ebfp.fcs',
...                   'FITC-A' : 'tasbe/eyfp.fcs',
...                   'PE-Tx-Red-YG-A' : 'tasbe/mkate.fcs'}
Estimate the model parameters
>>> bl_op.estimate(ex2)
Plot the diagnostic plot
Note
The diagnostic plots look really bad in the online documentation. They’re better in a real-world example, I promise!
>>> bl_op.default_view().plot(ex2)

Apply the operation to the experiment
>>> ex2 = bl_op.apply(ex2)
-
estimate(experiment, subset=None)[source]¶ Estimate the bleedthrough from simgle-channel controls in
controls
-
apply(experiment)[source]¶ Applies the bleedthrough correction to an experiment.
Parameters: experiment (Experiment) – The experiment to which this operation is applied Returns: A new Experimentwith the bleedthrough subtracted out. The corrected channels have the following metadata added:- linear_bleedthrough : Dict(Str : Float) The values for spillover from other channels into this channel.
- bleedthrough_channels : List(Str) The channels that were used to correct this one.
- bleedthrough_fn : Callable (Tuple(Float) –> Float) The function that will correct one event in this channel. Pass it the values specified in bleedthrough_channels and it will return the corrected value for this channel.
Return type: Experiment
-
-
class
cytoflow.operations.bleedthrough_linear.BleedthroughLinearDiagnostic[source]¶ Bases:
traits.has_traits.HasStrictTraitsPlots a scatterplot of each channel vs every other channel and the bleedthrough line
-
op¶ The operation whose parameters we’re viewing. If you made the instance with
BleedthroughPLinearOp.default_view(), this is set for you already.Type: Instance(BleedthroughPiecewiseOp)
-
subset¶ If set, only plot this subset of the underlying data.
Type: str
-